
PerformancePoint Services in SharePoint 2013 is a service that provides flexible tools to help us to create rich dashboards, scorecards, and key performance indicators in web browsers. PerformancePoint Service helps management users to analyse data for better business decisions.
Steps to Create Performance Point Service
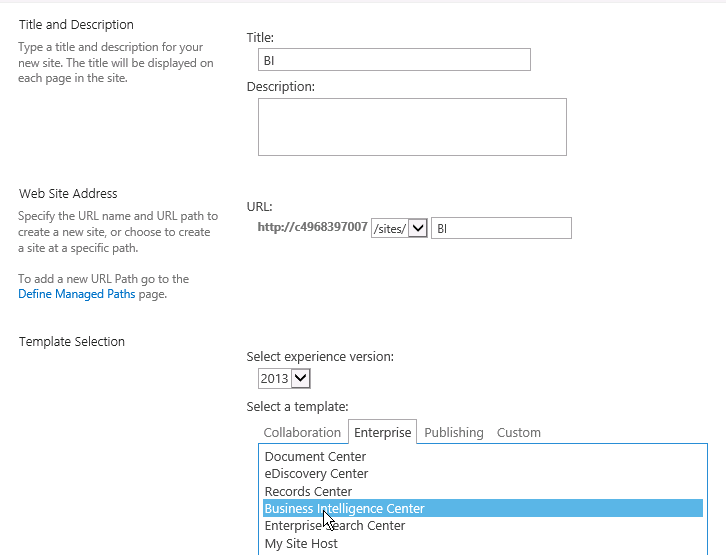
First, we have to create a Business intelligence site as shown below:
Once the site gets created, go to “Site Contents”
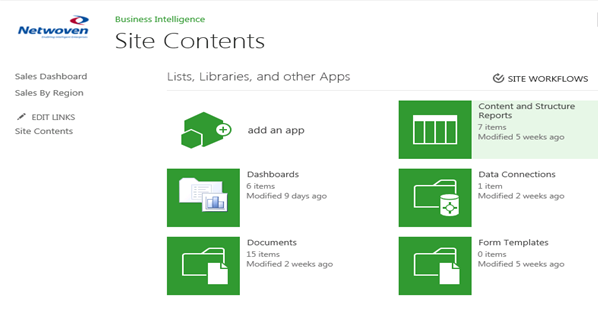
For designing a dashboard, click on the “Dashboards” library.
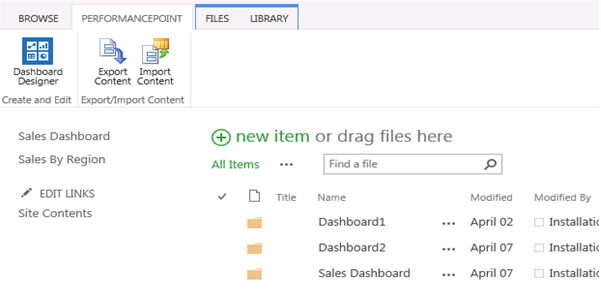
Go to ribbon “PERFORMANCE POINT” and click on “Dashboard Designer” as shown below
Launch the Dashboard Designer as shown below
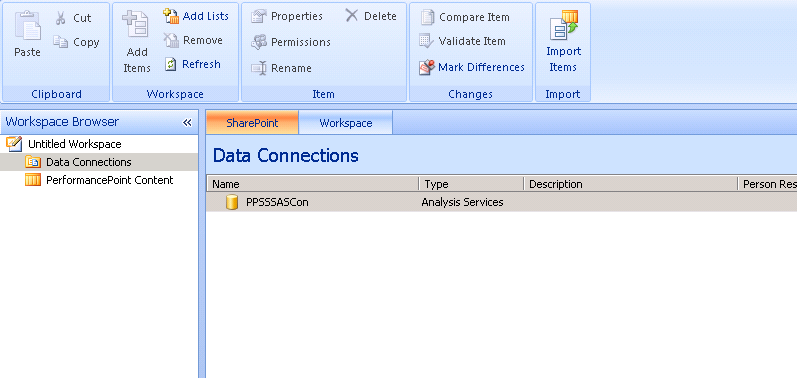
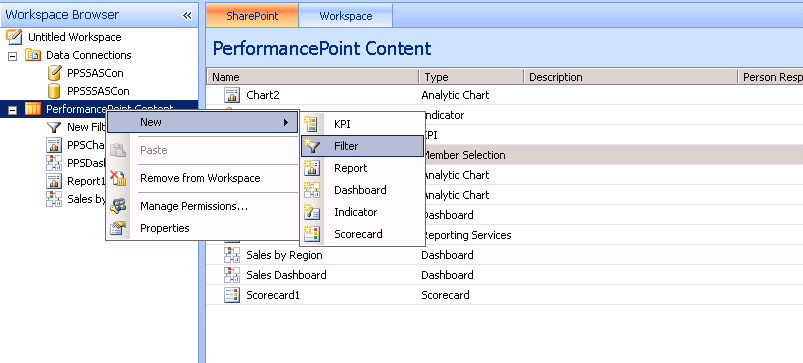
So the first step is to “create a Data Connection”. Right click “Data Connection” and click on “New Data Source”
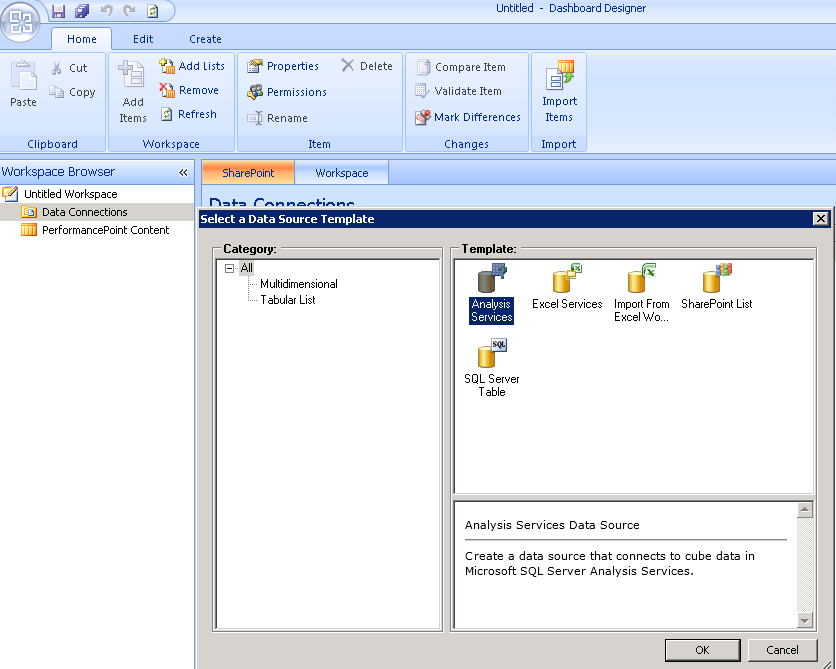
Various Types of Data Connection available in listed above. Choose “Multidimensional” and “Analysis Services”. Click the OK button as shown in figure below:
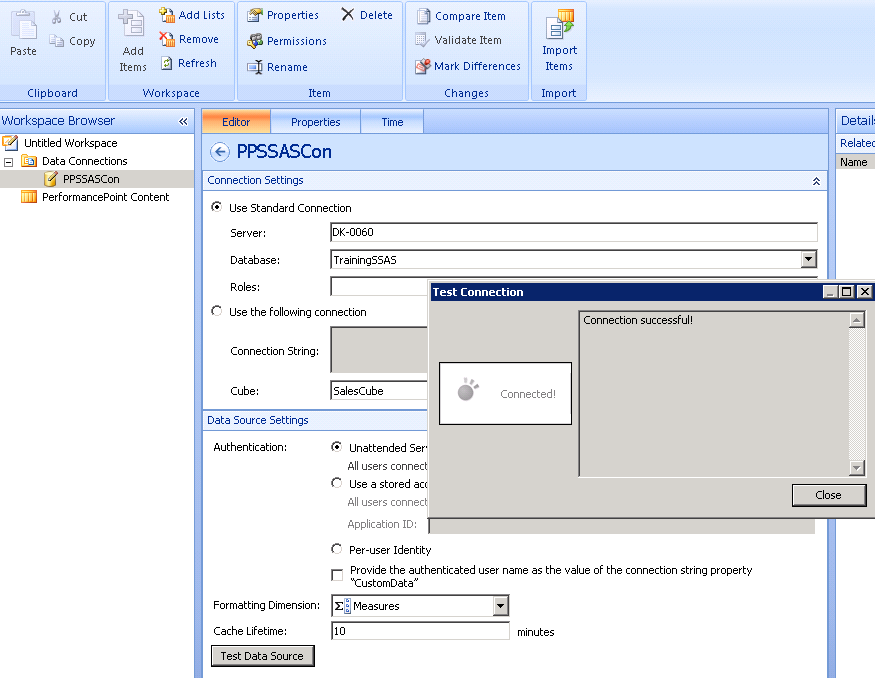
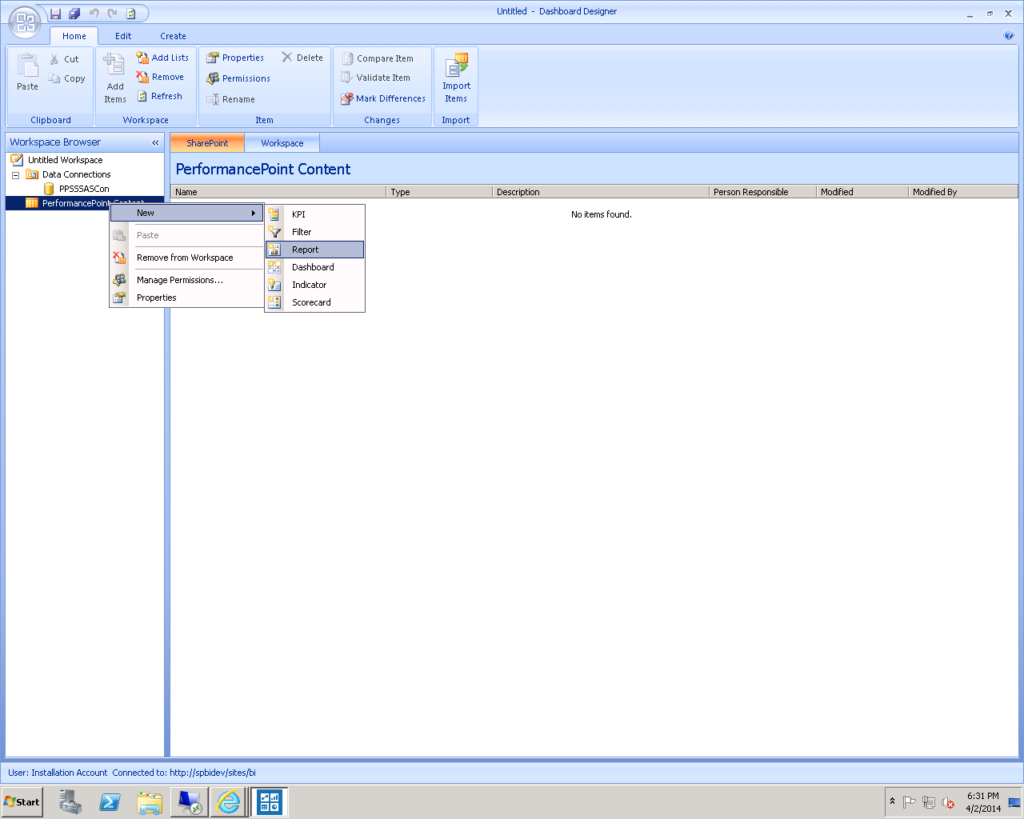
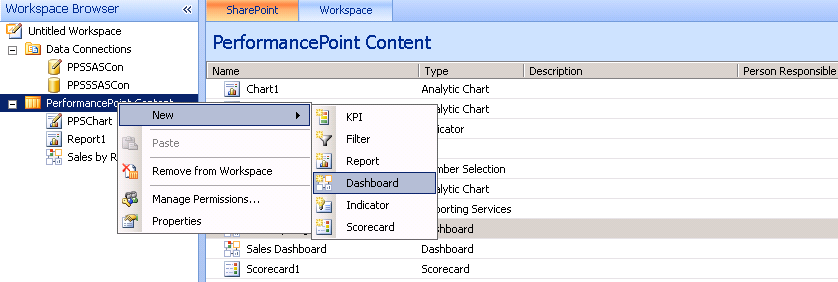
Create a connection string by specifying Server Name, Database Name and Cube name. Then Click on Test Data Source. Rename Data Connections as “PPSSSASCon” and Save this. Right click “PerformancePoint Contents”, New and select Report as shown below:
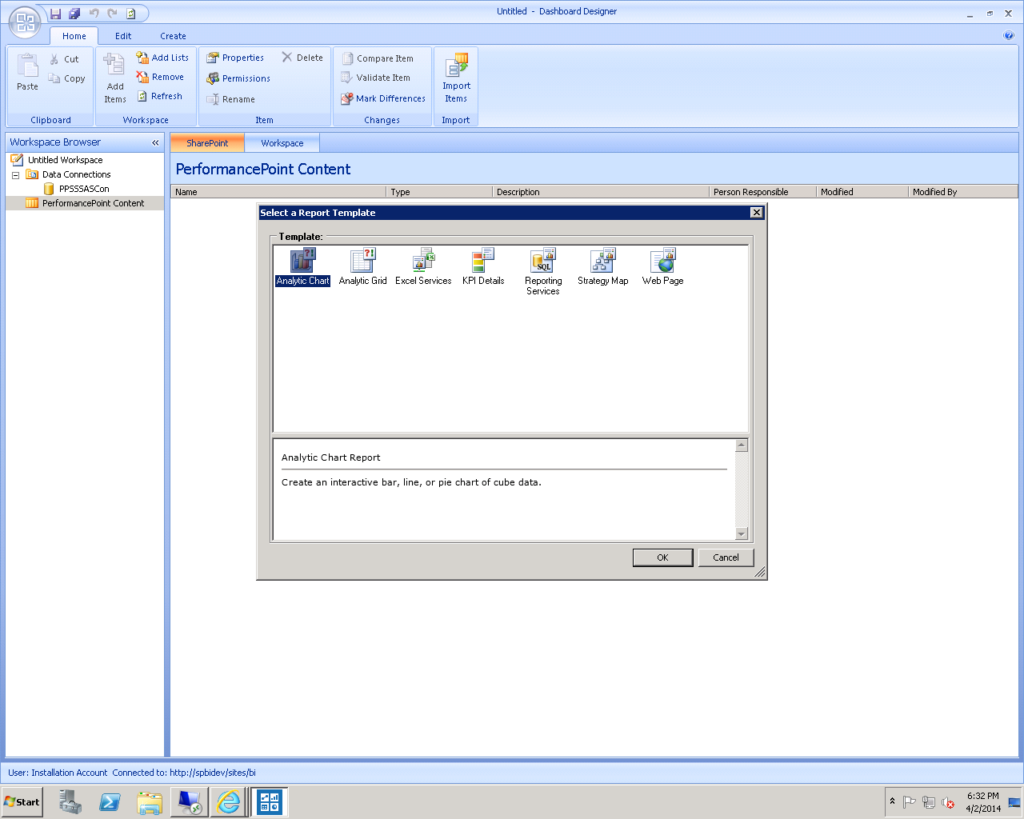
Select Analytic Chart and Click on Ok
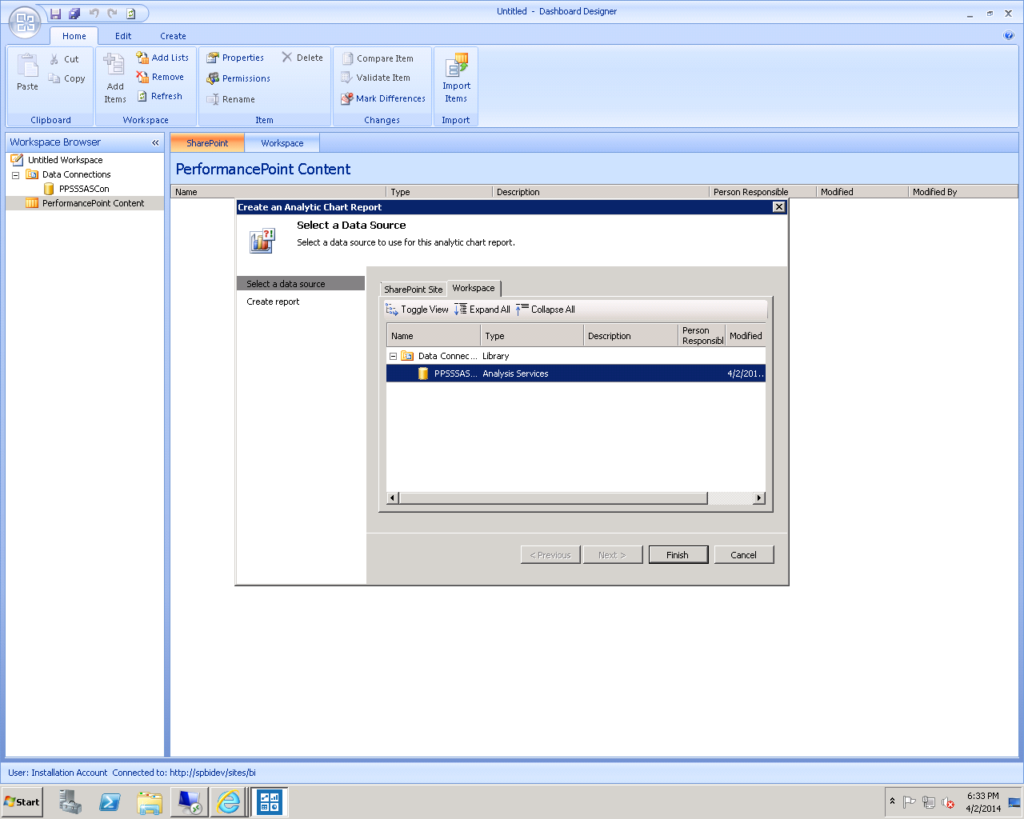
Choose Data Source you would like to use. Choose “PPSSSASCon”.
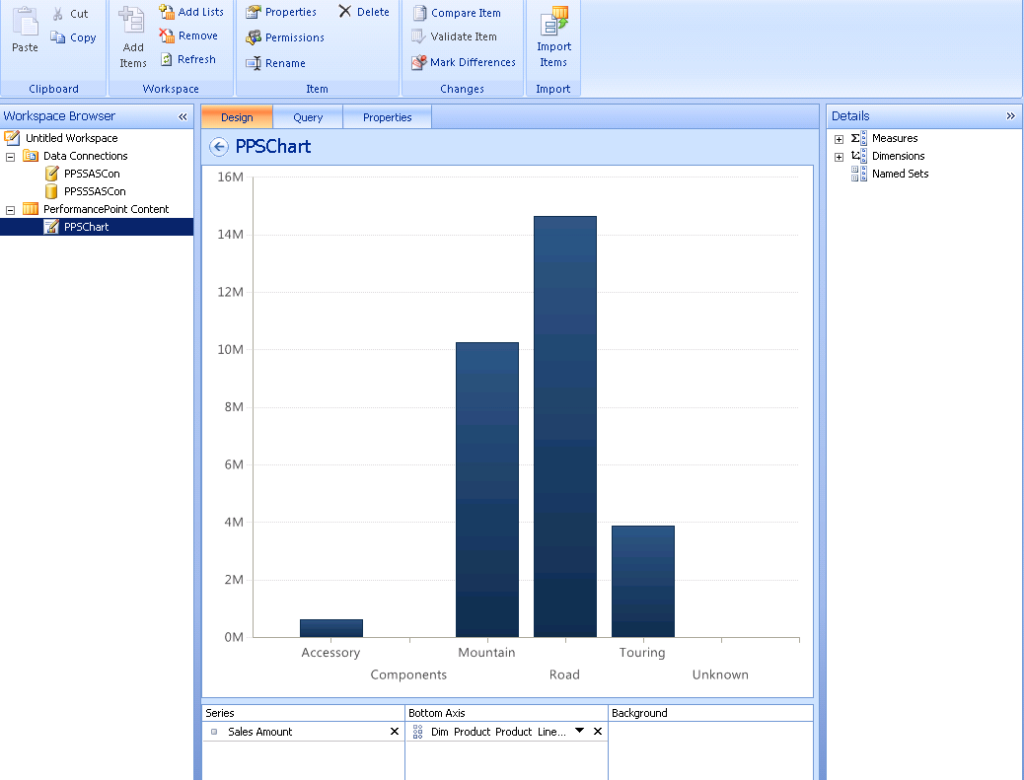
Click finish button. Rename the report as “PPS Chart”
From the Details pane which is on our right side, drag and drop measures and dimensions depends on the requirement.
Right click “PerformancePoint Contents”, New and select Dashboard as shown below:
Click on Dashboard to Create a New Dashboard Page Template as shown below:
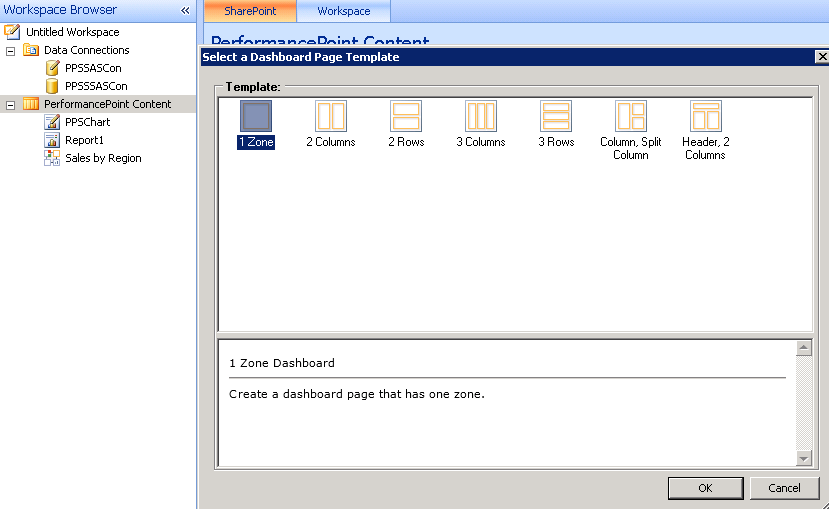
Select One Zone Report and Click on Ok
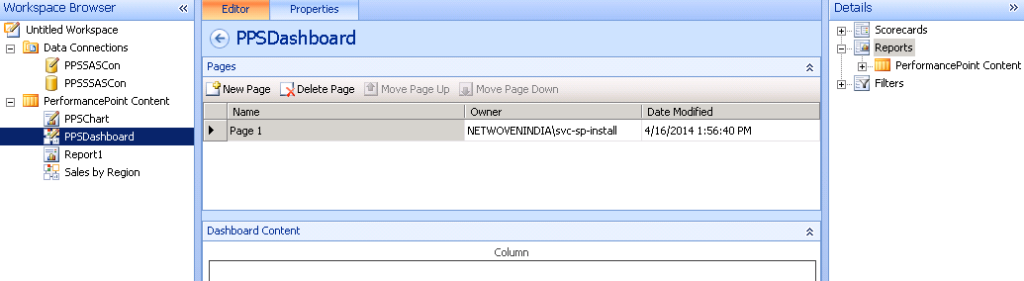
Rename it as PPS Dashboard
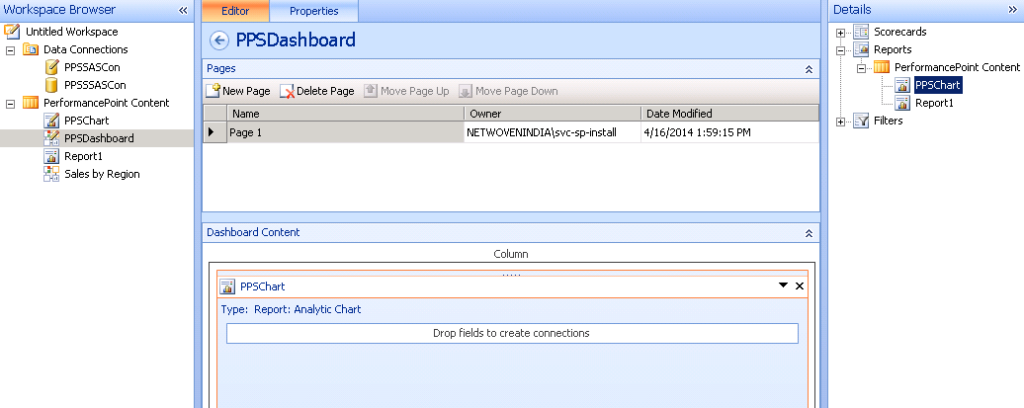
Drag and Drop the PPSChart from the Right pane details of the Performance Point Content as shown below:
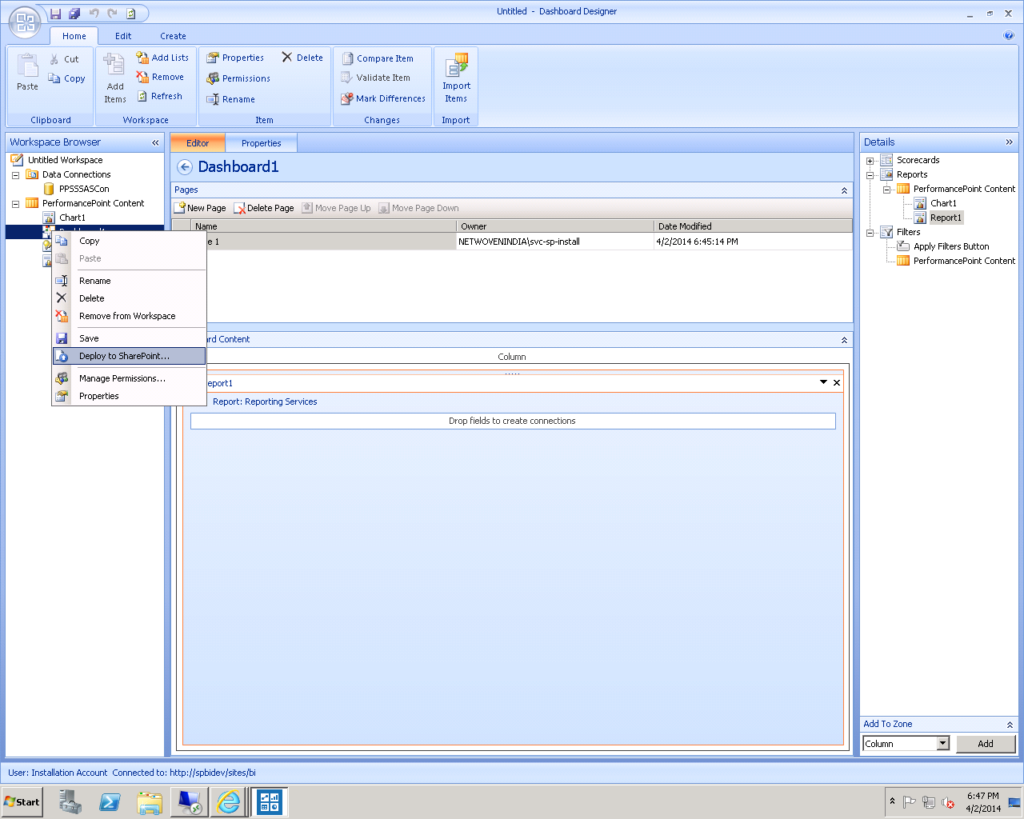
Save the Dashboard and Deploy the SharePoint site, Right click the “PPS Dashboard” and click on “Deploy to SharePoint”
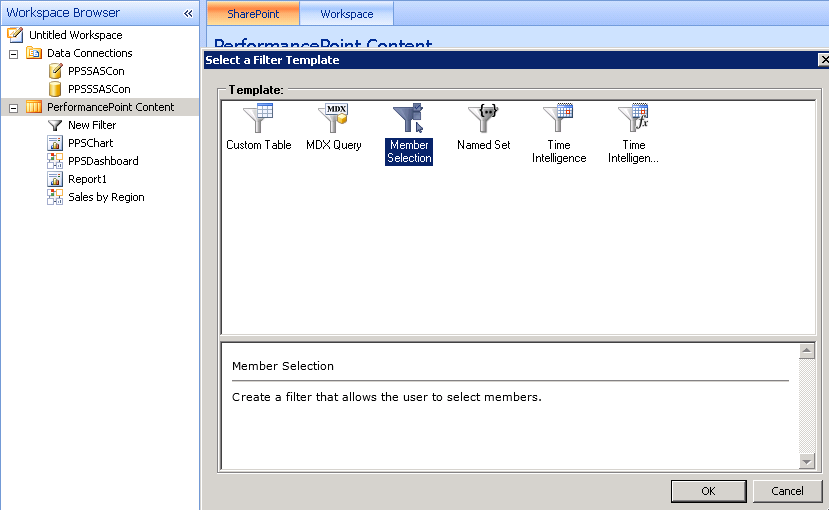
Create a filter for filtrations of Dashboard
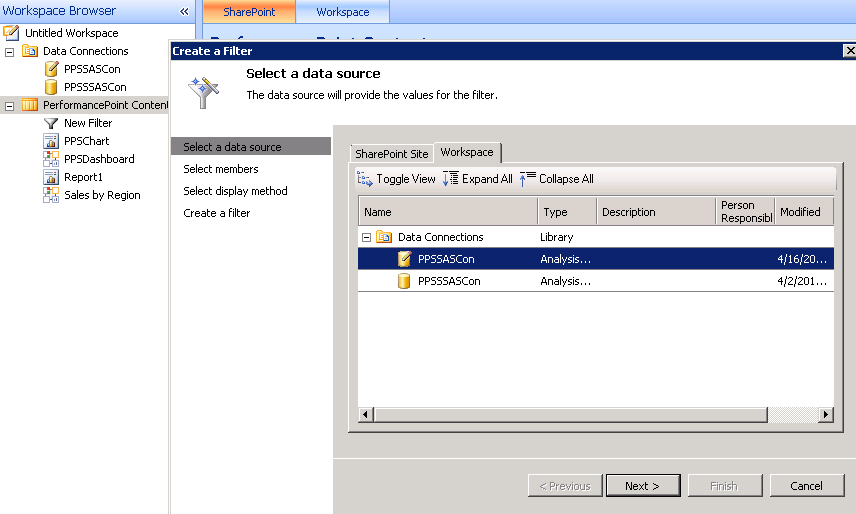
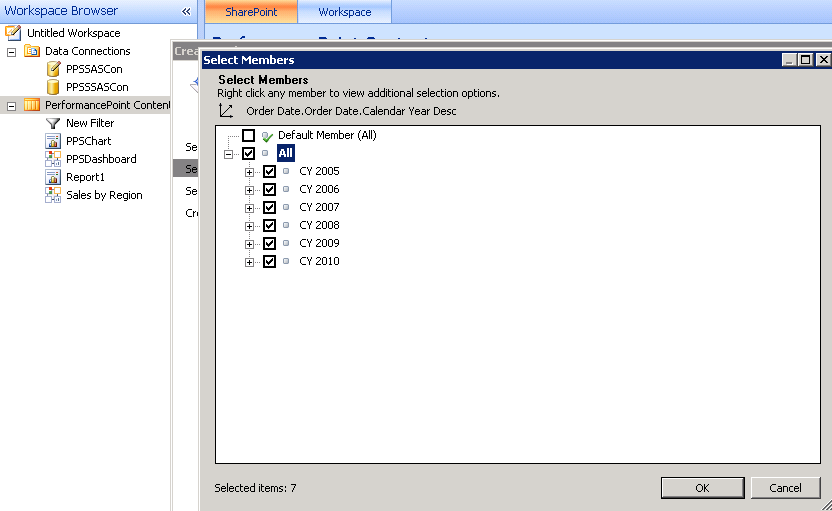
Select members sections and Click Ok
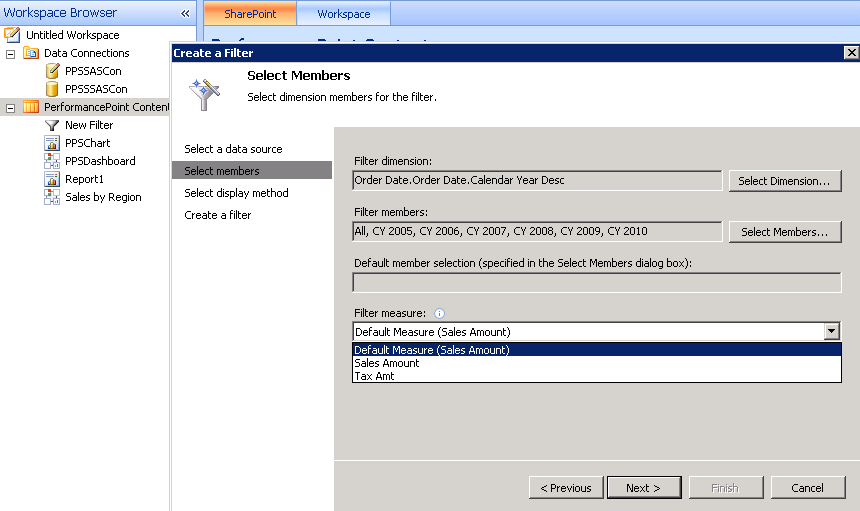
Select Analysis Service Connection “PPSSSASCon” and Next
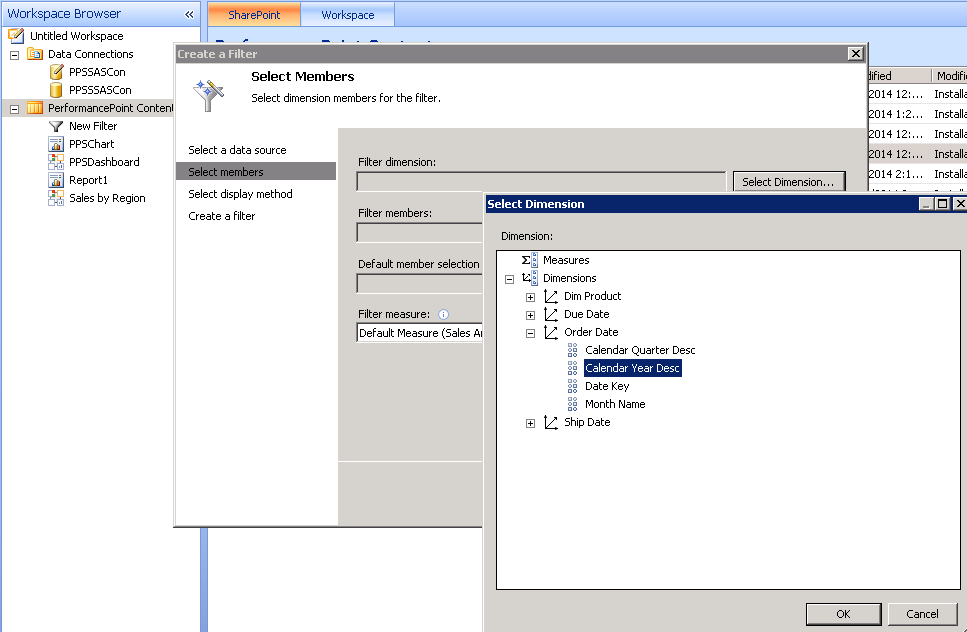
Select “Select dimendion” button from right side and choose “Calendar Year Desc” as filters and Click on Ok.
Then Select all filters members
After the two steps is done then select “filters measures” Sales Amount
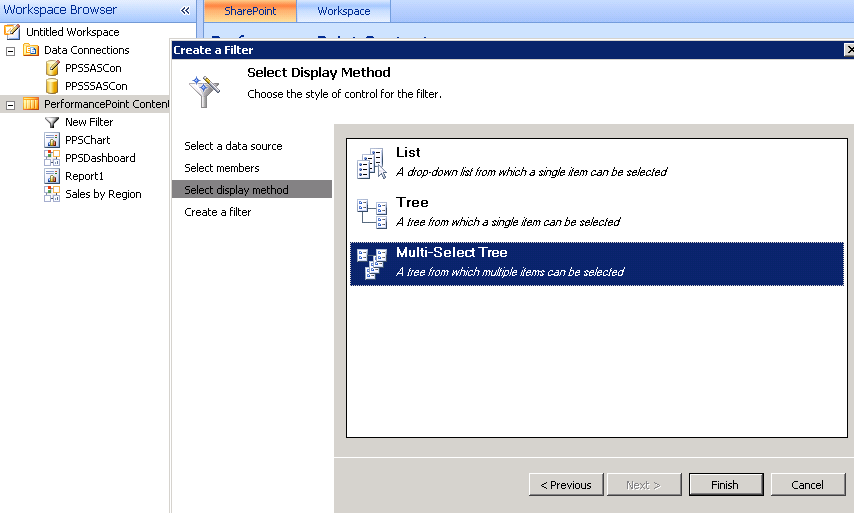
Click Next and “Choose Multi Select Tree”–> Click Finish and Rename Filters as “PPSFilters”
Again Go to “PPSDashboard” and drag and drop the PPS Filters to Dash board section
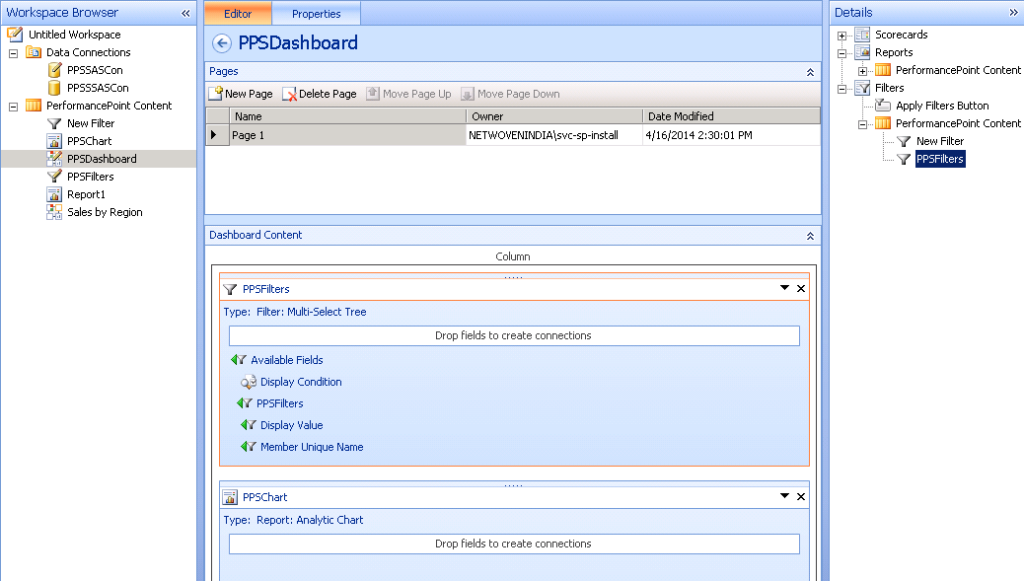
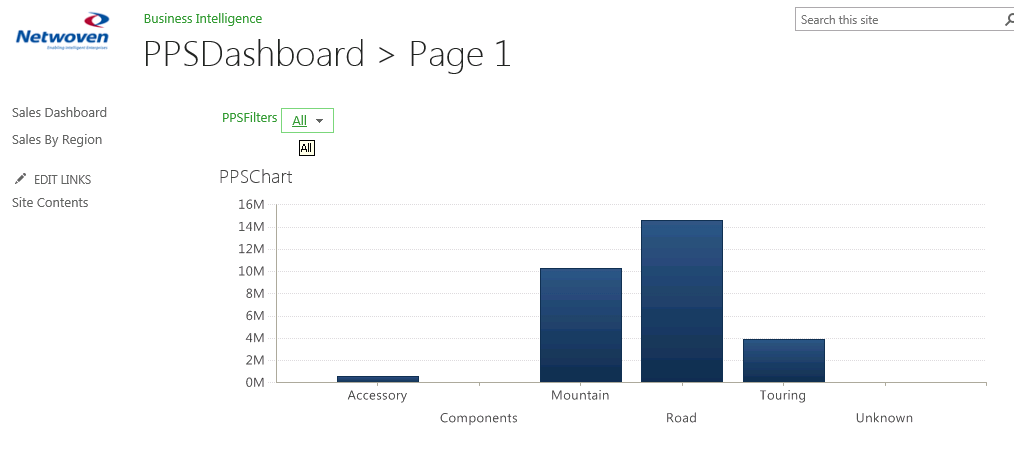
Now the following PPS Dashboard is ready to use after the deployment