Creating a dashboard might not be the primary requirement while working on Dynamics 365 CRM. However, no data manipulation is complete without its representation. Also, you need not be an expert in Dynamics 365 CRM if your forte is only data representation, though knowing how to work around the system to get the components you need, is imperative.
If this keeps you captured, keep reading further.
Introduction
Anyone working with charts would know how a certain chart would appear with the provided input parameters. If you do a quick search on the internet, you would also get help on creating dashboards, however not many articles or videos specify that what you are being hand-held to create is just a personal dashboard.
Well if you are someone who likes to work with your team and improve their performance and also the projected numbers then you might also like your team to regularly check statistics and also contribute to improve them.
Use case
My first use case was to create a very basic custom dashboard with charts that pulled data from the entity or record type Account and have the team access it.
However, as mundane as it may sound, for someone who isn’t proficient in the application and has just begun to uncover the menu actions on Dynamics 365 CRM, creating a dashboard available to all users comes with a few bummers.
The first roadblock that came to me right at the start was that the Dashboard creation in the menu actions just ended in creating a personal dashboard while I was aiming to create one that would be visible to my entire team.
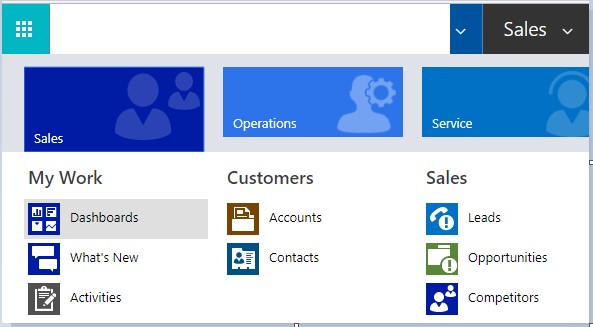

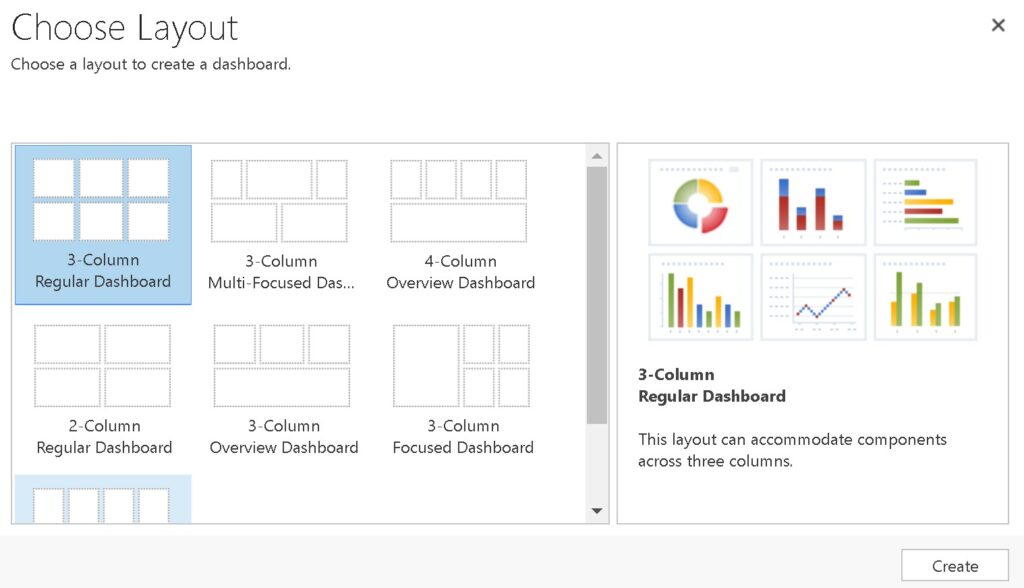

So, if you thought that creating a dashboard from the one in the above screenshot was what that was needed to be done, you might just end up creating a personal dashboard that shows up under My Dashboards something like in the following screenshot.
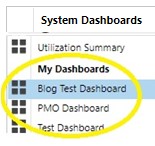
However, your intent to create a dashboard which your entire team can refer to comes under System Dashboards.
Resolution
One of the ways is to Share the dashboard with the required team members. This becomes difficult to manage when multiple personal views or charts are also used in the dashboard, as it requires sharing those charts as well. Another drawback is exporting of personal dashboard is not enabled hence moving a dashboard to another environment requires recreating the dashboard from scratch.
Recommended approach in this is to use System Dashboards. Detailed steps to do so are described in below steps –
Step 1 – Check the Security Role
You should first check if your security role is of the System Administrator. If you are one, you should then be able to navigate from the breadcrumb navigation, and go to Settings > Customization > Customizations

Of the available options, click Customize the System.

Step 2 – Create a System Dashboard
Anything that you wish to create for all users here comes under the umbrella of Default Solution. Hence creating a dashboard meant to be visible to the entire team starts right here.
Click on Components > Dashboards and now create a new dashboard.
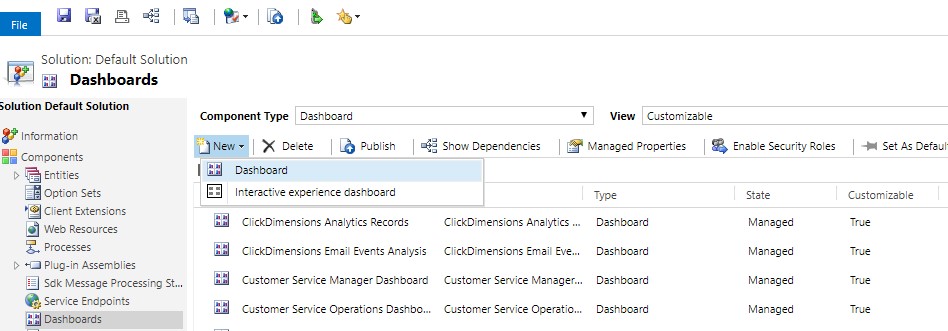
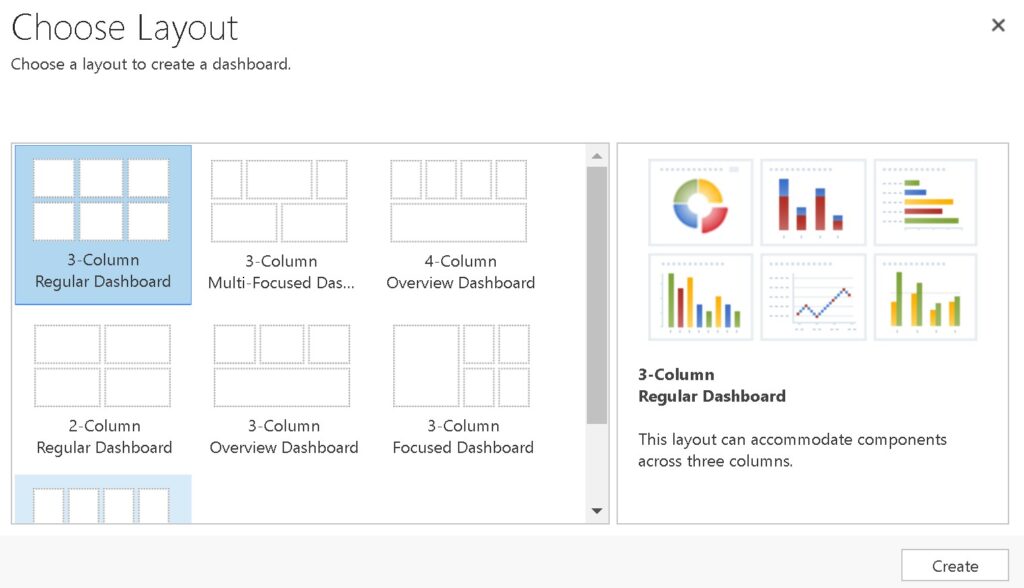
Choose a layout and Create one and name it.

You can confirm that the process was successful as you see your dashboard show up in the list.
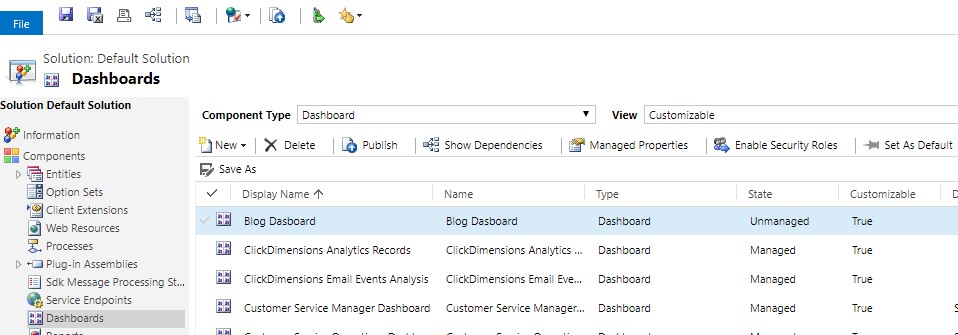
However, for the dashboard to show up in the list on the home page, select and Publish it.

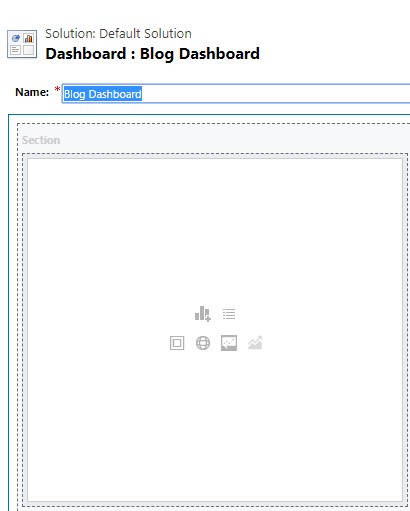
The dashboard you just created is just a blank area that needs some visuals.
Step 3 – Create a View for Chart
Let’s start with a very basic visual of inserting Charts.
Select the Entity you want to create a chart for. You could work from an existing view or create a new View.
Similar caveat as creating a dashboard – a view can be used in the chart only if it is a system created. So expand the node of the entity you want to create a view for and go ahead creating one.
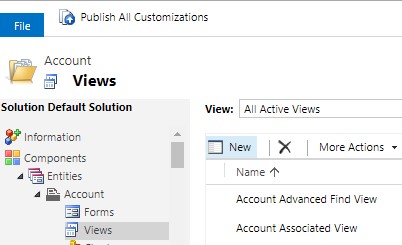
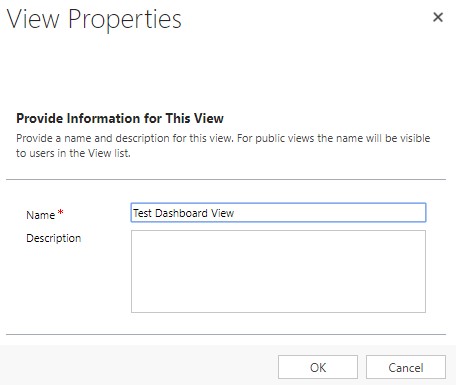
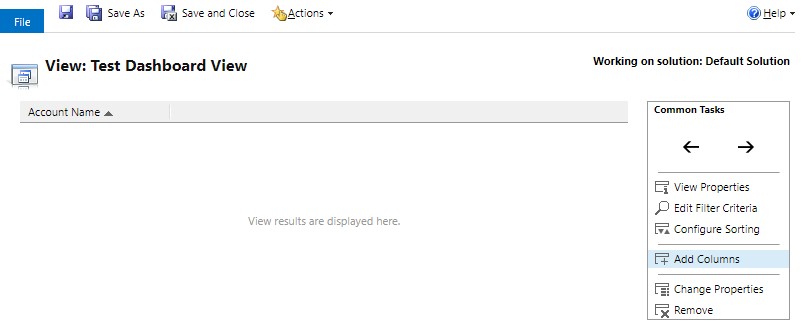
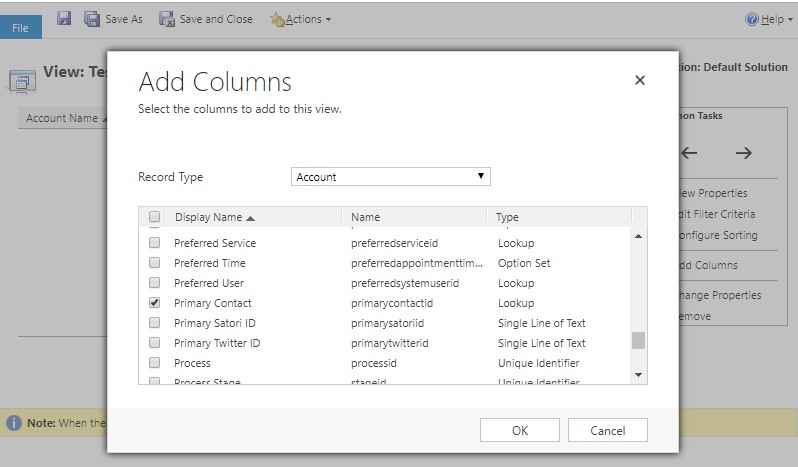
You can customize your view now by adding columns, configuring sort and filters.
Step 4 – Create a Chart Visual
Once you have identified an existing or created a new system view to be used in the chart, click on the Chart node and create a new one or use an existing one to go into the dashboard.
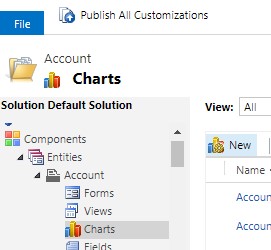
In my case, I’ve created a new view for the chart so that I can demonstrate to the same system view as reference.
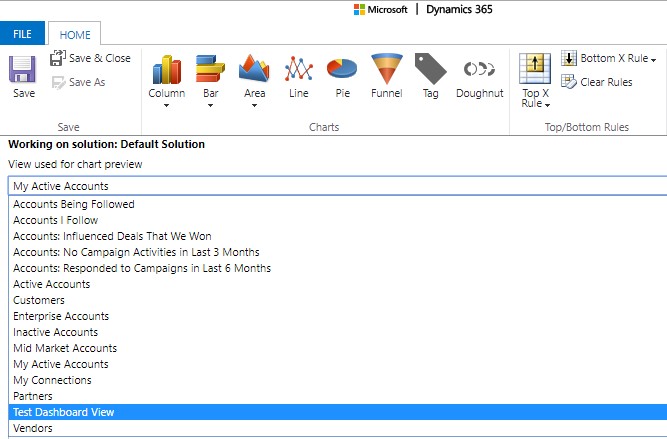
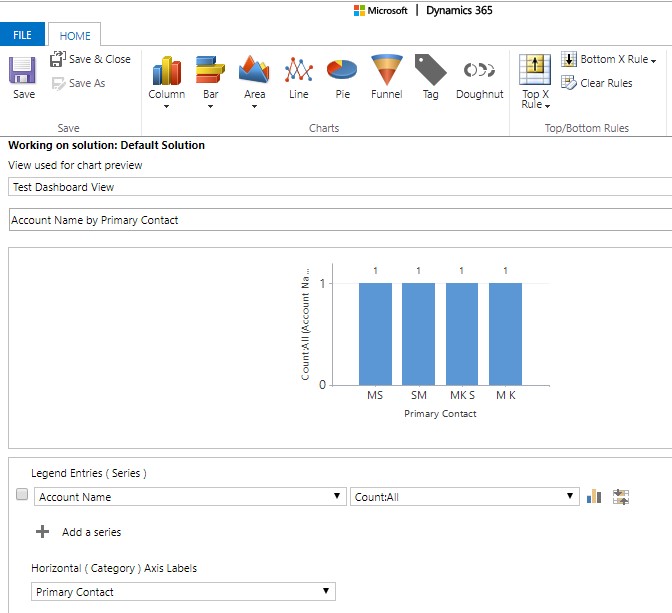
As a final step, publish all customizations so that your work shows up on the System Dashboard.
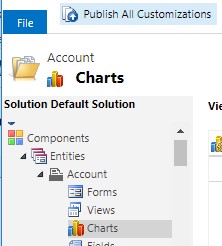
Step 5 – Add Component to the Dashboard
Reopen your dashboard and click on the Insert Chart on any of the tile in the layout and select the Record Type, View and Chart to add that as a tile component.
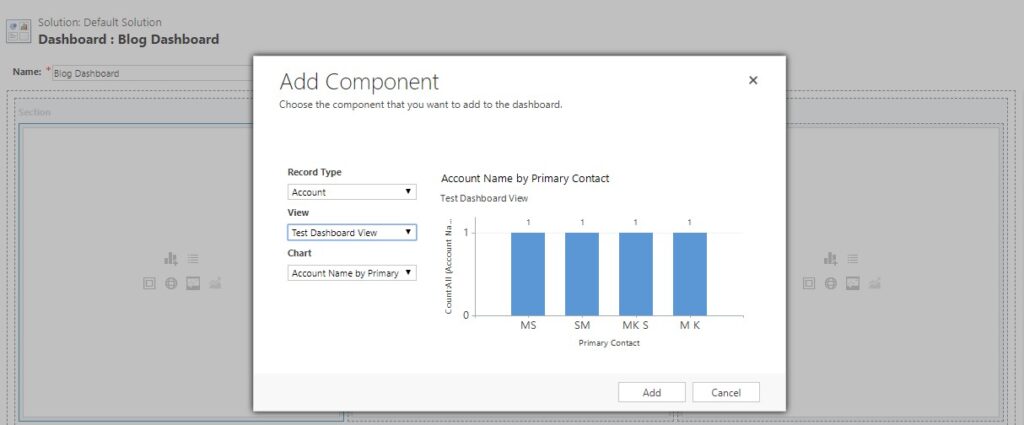
Depending on the chosen dashboard layout, you can go ahead and fill all the other tiles likewise.
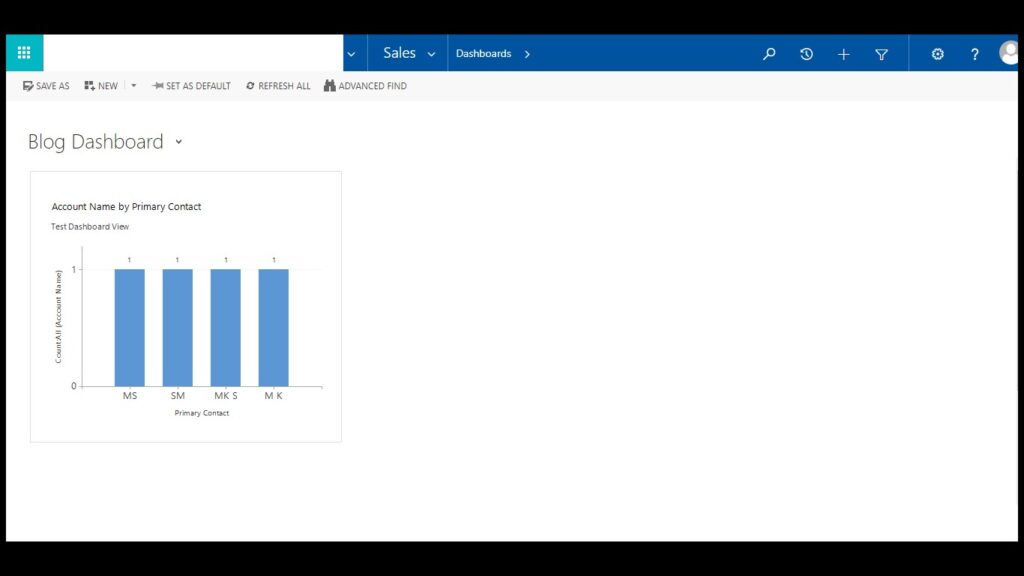
Your final dashboard should start showing up data something like the one below or rather a more pleasant visual once you start filling in other tiles.
Conclusion
This is just a starting to create a dashboard. What I was assigned next was even more interesting though a lot simpler from what I initially thought it might be. Stay tuned for the next in the series!





Awesome stuff!!! How would you create a tile that simply shows a total?