We have often come across scenario where we need to shift the data based on some filtering criteria. So, we just need to eliminate the rows which are not part of the criteria which is the essence of filtering or slicing the data. Now if we come across a scenario when while creating a report where the number of columns keeps changing based on some filter value or in simple terms the number of columns is dynamic, it will be tedious to accomplish. Though this scenario is not common but having a solution to manage this unique use case would be nice to have.
Hence, let me run through a perspective before we delve into the technical aspect of this use case.
Let us think about a fictitious company ticket booking company airticket.com. Now the company has details of places a person has visited for last 10 years. This would be a valuable information that could have an upsell value for other agencies. Now imagine tens of thousands of customer data like this, and it is gold in terms of information to a hospitality company. However, representation of the data is simple person versus the places visited. The company would rather be interested to see the data other way around as in the places visited versus the persons. This makes the data more relevant for a hospitality company. Hence, we need to re-format and represent the data in a transpose manner.
Once we have the desire to see the data in the transpose format we have unknowingly accepted the number of columns in our table and essentially our chart to be dynamic.
Let us look at this example.
Let us say airticket.com has the below data for top 10 customers and the 10 places they have visited most in last 10 years.
| Customers | Places Visited | |||||||||
| Aida | Hong Kong | Helsinki | Frankfurt | Milan | Las Vegas | Moscow | Taipei | Rome | Copenhagen | Brisbane |
| Allie | Taipei | Rome | Copenhagen | Brisbane | Orlando | Oakland | Hong Kong | Miami | Amsterdam | Milan |
| Emily | Honolulu | Edinburgh | Paris | Melbourne | Sydney | Miami | Amsterdam | Milan | Las Vegas | Moscow |
| Emma | Paris | Melbourne | Sydney | Miami | Amsterdam | Milan | Las Vegas | Moscow | Taipei | Rome |
| Faber | Rome | Copenhagen | Brisbane | Orlando | Oakland | Hong Kong | Helsinki | Frankfurt | Melbourne | Sydney |
| Loni | Brisbane | Sydney | Miami | Amsterdam | Milan | Las Vegas | Moscow | Taipei | Rome | Copenhagen |
| Maureen | Copenhagen | Brisbane | Orlando | Oakland | Hong Kong | Helsinki | Frankfurt | Sydney | Miami | Amsterdam |
| Peggy | Melbourne | Sydney | Miami | Amsterdam | Milan | Edinburgh | Hong Kong | Rome | Copenhagen | Honolulu |
| Peggy | Melbourne | Sydney | Miami | Amsterdam | Milan | Edinburgh | Hong Kong | Rome | Copenhagen | Honolulu |
| Rosaline | Copenhagen | Paris | Melbourne | Sydney | Miami | Amsterdam | Milan | Las Vegas | Moscow | Taipei |
| Teri | Las Vegas | Moscow | Taipei | Rome | Copenhagen | Brisbane | Paris | Melbourne | Sydney | Miami |
As mentioned, before we will have to represent the data in a transpose manner to make it relevant for a hospitality company. So now the data will be represented as is shown below.
| Places Visited | Customers | ||||||||
| Amsterdam | Emily | Emma | Rosaline | Loni | Maureen | Allie | Peggy | ||
| Brisbane | Loni | Maureen | Faber | Aida | Teri | Allie | |||
| Copenhagen | Rosaline | Maureen | Faber | Aida | Teri | Loni | Allie | Peggy | |
| Copenhagen | Rosaline | Maureen | Faber | Aida | Teri | Loni | Allie | Peggy | |
| Edinburgh | Emily | Peggy | |||||||
| Frankfurt | Aida | Maureen | Faber | ||||||
| Helsinki | Aida | Maureen | Faber | ||||||
| Hong Kong | Aida | Maureen | Faber | Allie | Peggy | ||||
| Honolulu | Emily | Peggy | |||||||
| Las Vegas | Emily | Emma | Rosaline | Aida | Teri | Loni | |||
| Melbourne | Emily | Emma | Rosaline | Faber | Peggy | Teri | |||
| Miami | Emily | Emma | Rosaline | Loni | Maureen | Teri | Peggy | ||
| Milan | Emily | Emma | Rosaline | Aida | Loni | Allie | Peggy | ||
| Moscow | Emily | Emma | Rosaline | Aida | Teri | Loni | |||
| Oakland | Allie | Maureen | Faber | ||||||
| Orlando | Allie | Maureen | Faber | ||||||
| Paris | Emily | Emma | Rosaline | Teri | |||||
| Rome | Faber | Emma | Peggy | Aida | Teri | Loni | Allie | ||
| Sydney | Emily | Emma | Rosaline | Faber | Maureen | Teri | Loni | Allie | Peggy |
| Taipei | Loni | Emma | Rosaline | Aida | Teri | Allie | |||
Now to show this table or report would have the number columns varying depending on the selection of the places visited. Let us say you want to filter the data by the city Honolulu you will have just two columns, but if you choose Sydney you will have 10 columns. So that should set the sentiment of how we got this elegant data set which should have dynamic columns set in the report.
So far so good but how do we achieve this. For that aspect let us move to the technical part of this discussion and let us start from the humble data presented in the TicketOrderHistory table first.
Sample of the TicketOrderHistory
| CustomerName | Source | Destination | NumberofTimeVisited |
| Allie | Newark | Amsterdam | 3 |
| Emily | San Antonio | Amsterdam | 3 |
| Emma | Lyon | Amsterdam | 3 |
| Loni | Mumbai | Amsterdam | 4 |
| Maureen | Mexico City | Amsterdam | 1 |
| Peggy | Osaka | Amsterdam | 4 |
| Rosaline | Oakland | Amsterdam | 1 |
| Aida | Athens | Brisbane | 1 |
| Allie | Newark | Brisbane | 2 |
| Faber | Budapest | Brisbane | 4 |
| Loni | Mumbai | Brisbane | 5 |
| Maureen | Mexico City | Brisbane | 2 |
Now in this excerpt of the TicketOrderHistory table you can visualize how the data is designed to show the holiday destinations a person has visited along with the frequency of visit.
Now let us see how we can import this data into Power BI and how we can present this data in a simple chart to add meaning to the data.
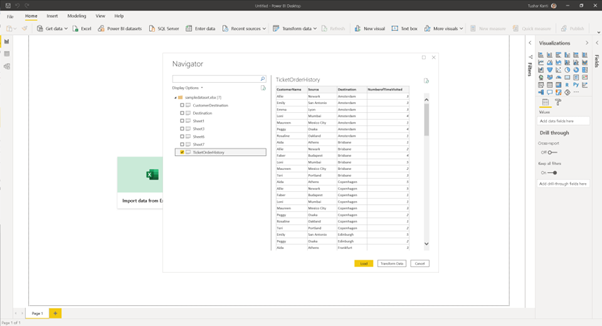
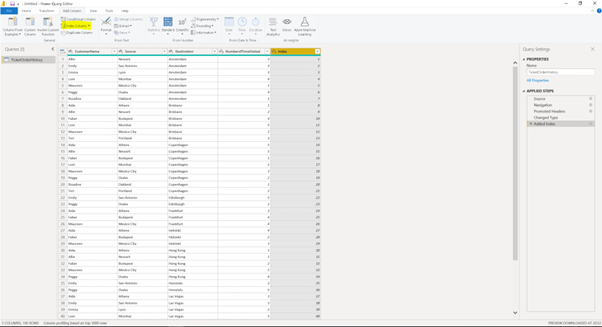
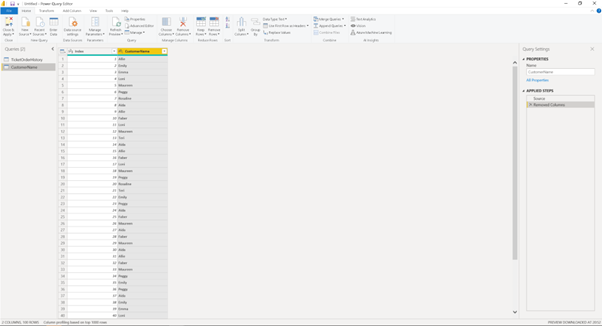
Open a new Power BI Report and add a data source excel and import the data from the sheet TicketOrderHistory. Click on Transform and add a new Index Column to the table as is shown below.
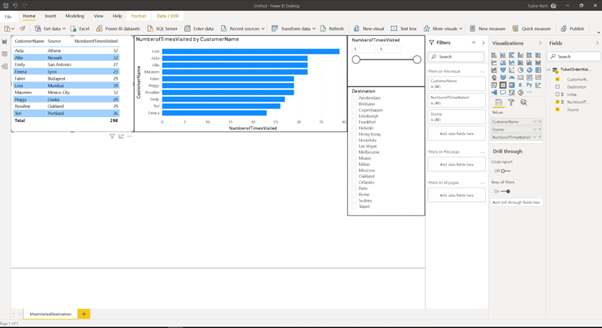
Now let us create a very basic report in the sheet1 which we have renamed to MostVisitedDestination. Here we have presented the data for the customers vs the number of times they have gone for the holiday destinations as a sum. We have shown the data in form of a table and a bar chart. We have added two slicers one for the NumberofTimesVisited and the other for the Destination itself.
Now we move to the next phase where we need to see the data in the transpose manner. To do that we will again edit the query and go to the query editor.
We will use the TicketOrderHistory table and create a reference to a new table. Rename the new table as CustomerName and remove all columns except CustomerName and Index.
Go to transform in the Top Ribbon.
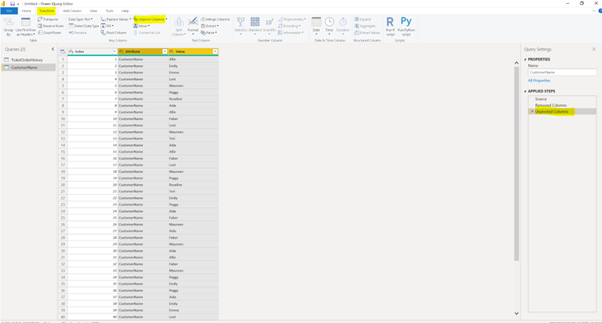
Click on the CustomerName column and click on Unpivot Columns.
Your CustomerName table will have a two new columns Attribute and Value.
The Attribute will have just one value that is CustomerName and the Value column will have the actual names of the customers. Key thing to see here is the Index number still maintains the right order in which the CustomerName appeared. It will help us put the pieces in the puzzle.
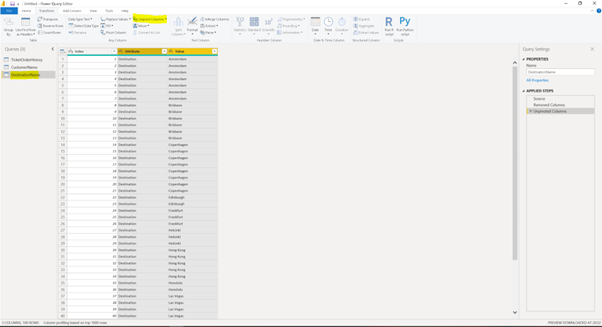
Now we need to add another reference to TicketOrderHistory and create a new table DestinationName. We will need to remove all the columns except the destination and the index.
Then choose the Destination Column and click on unpivot. We will see the table structure as is shown below.
Now we will click close and apply in the query editor.
Now let us add the final table that we need for representing the data. We will use a Matrix to represent this data.
We will first choose the Destination Table and select the dimension Value this will show the name of the Destinations in the left-hand side. Now we will choose the CustomerName table and then select the dimension value. At last we will choose the TicketOrderHistory Table and choose the measure NumberOfTimesVisited.
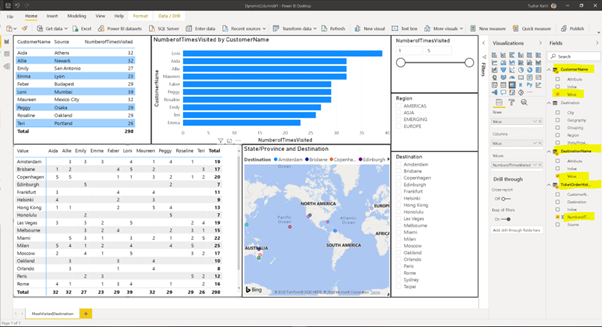
So now if I want to see the people who visited Paris we will just need to choose Paris from the slicer and then you will see the Customer name columns modify dynamically based on your choice of the city.
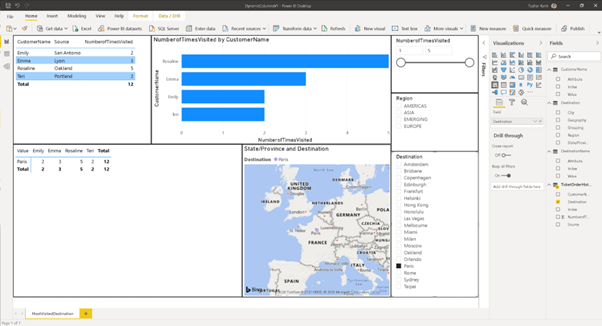
Now if you see closely the number of Customer Columns have changed from 10 to 4. This is grazing the surface of the dynamic columns in Power BI and there is lot to it. The idea behind this blog was to show how the dynamic columns in Power BI can be created and utilized.