Unpivoting columns comes as part of the package when you are doing a tutorial on Power Query or Power BI. I’m sure, many (like me), do not really understand the use and go scampering searching for functions when it was the need to unpivot columns.
Use case or Scenario
Since we’ve already read volumes of what is done in unpivoting columns, let’s quickly jump to the scenario of what is given, moving to expectations to understand what is needed, and finally ending with the solution of how to do it.
Let’s say I’ve a tabulated data of a certain number of tasks assigned to a group of users, which is tabulated as below.
| Task Name | User 1 | User 2 | User 3 | User 4 |
| Task1 | x | x | ||
| Task2 | x | x | ||
| Task3 | x | x | ||
| Task4 | x | x | ||
| Task5 | x | x | ||
| Task6 | x | x |
I like the row-column representation which makes readability easier, but when it comes to calculation, I find it easier working with data arranged in rows, with fewer columns to filter. If you still don’t understand what I intend to highlight, try doing the following calculations:
- Find how many persons performed any specific task, say, Task #2
- Find how many different tasks did any specific user perform, say User #1
It may not seem challenging now since the number of tasks and number of users performing those tasks is finite (read countable). However, with the increase in the user or the type of tasks, you’d wish doing it with the help of a function.
Expectation or Result
If I translated the same table into a slightly different structure, you’d exclaim with the same emotions as Archimedes used when he discovered Buoyancy – Eureka! After all, it’s just a matter of perspective.
Let’s see how we can do our calculations if the data was projected something like in the table below.
| Task Name | User |
| Task1 | User 3 |
| Task1 | User 1 |
| Task2 | User1 |
| Task2 | User 4 |
| Task3 | User 2 |
| Task3 | User 3 |
| Task4 | User 1 |
| Task4 | User 4 |
| Task5 | User 2 |
| Task5 | User 4 |
| Task6 | User 1 |
| Task6 | User 3 |
Coming back to my favorite application Power BI, if I could succeed in transposing my data like the one above, I knew my calculations were just a click away.
I would easily split my visual data into two tables of the single column each so that they looked like the ones below
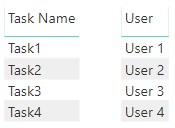
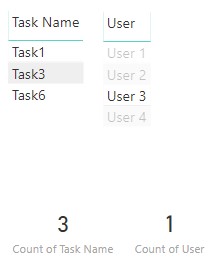
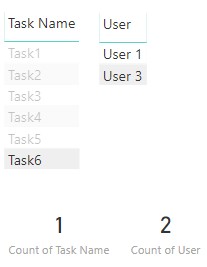
Needless to remind you of the prowess of visual representation of Power BI, the tables would be connected so that my visual filters would work like the one below
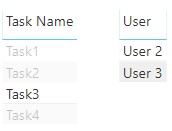
If this was not exactly what you were expecting when you thought I asked you found the exact count, you could further add a count to the visual.
On selecting the Task Name the names of Users performing the task would be filtered along with the display of count.
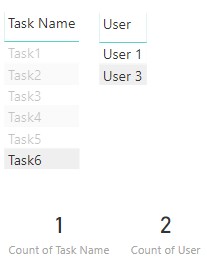
And on selecting the User, the linked Task Names along with the count would be updated.
Solution
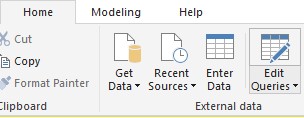
On the Power BI Desktop window, go to Home > Edit Queries
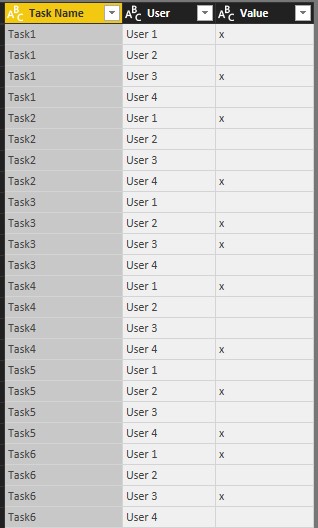
On the Power Query Editor window, select the table, and then select the columns to unpivot and go to Home > Unpivot Columns

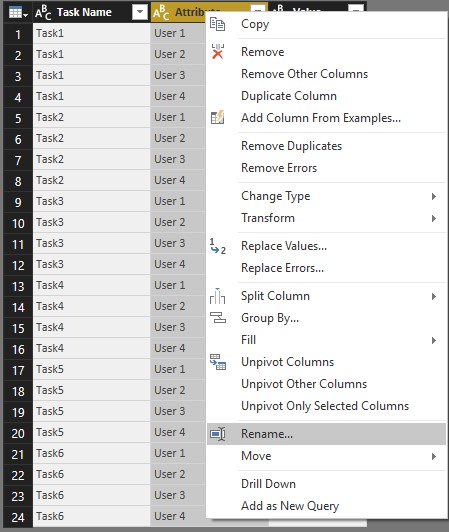
The table is transformed such that the column names corresponding to usernames become the Attribute and all the marked ‘X’ become the value.
Right-click on the column name Attribute and rename it to User for ease of comprehension.
Click on the column Value and do an ascending sort.

The next step is to remove the top blank rows from Home > Remove Top Rows.
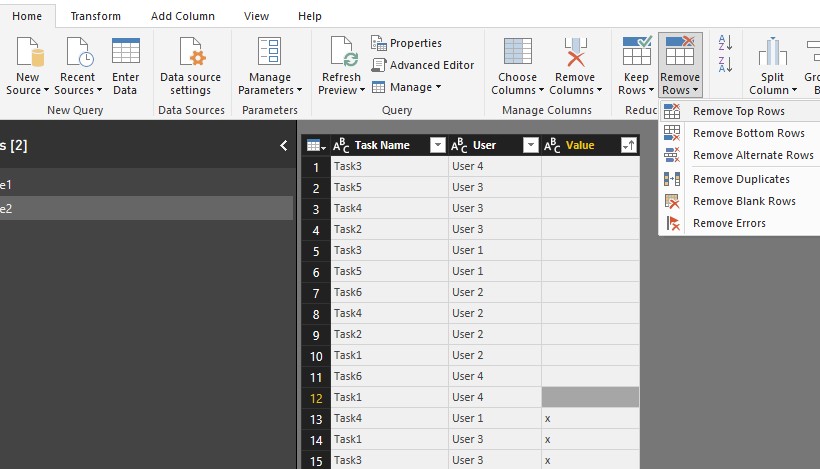
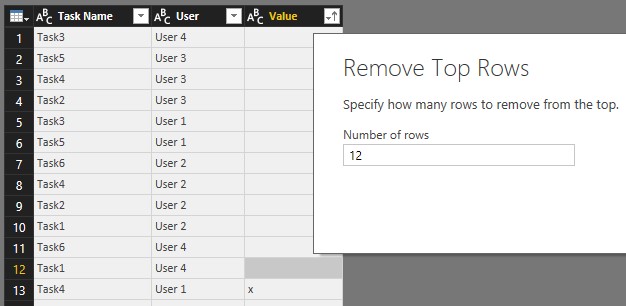
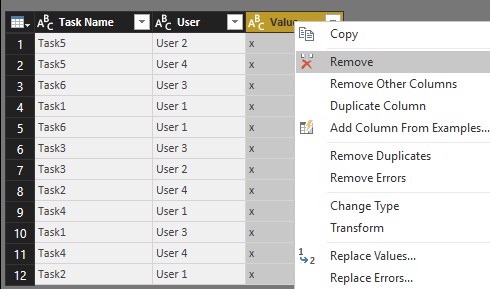
Right-click on the Value column and Remove it.
As a final step (though not mandatory), perform ascending sort on Task Name to make the column ordered.
Advantage
Of the many advantages, I’ve also discovered that any semi-formatted or unformatted data if brought to the state where we first saw the row-column arrangement can easily be evaluated.
As an extended use case, I’ve also worked on values separated by special characters which I split into columns using delimiters before I could format the table into a row-wise data representation.
More to divulge in my next blog 🙂

