Many a time in D3 charts there might be a requirement to add gradient inside shapes (like circles /squares /rectangles). In that case, one needs to add a linear gradient to the charts and use it to dynamically fill the shapes. In this example, I will show how to achieve this in circles.
Method of adding gradient to D3 shapes in charts:
Create a sample Angular 4 App:
- To create a sample application first open console in a system which has node.js, npm and angular-cli installed.
- In the console go to a folder (say Project) and inside it, write the following command:
ng new circle-grad
- This would create a folder circle-grad with all necessary angular files contained in it.
- To run this sample application, go to console and type the following commands:
cd circle-grad
ng serve –o
- This will open the sample angular application in the default browser at port 4200(default port)
Install D3 to the sample App:
- In console go to circle-grad folder and type the below commands to install D3:
npm install –save d3
npm install –save -dev @types/d3
Create child components in the sample App:
I created two child components to depict vertical and horizontal gradient in the charts.
- To create child components, go to circle-grad folder in console and type the following commands:
ng g component shared/circlex
ng g component shared/circley
Add svg to the sample App:
- Add svg and child component references as shown in the sample application:
app.component.html
<div id="graph-panel-wrapper">
  <div id="graph-container" style="position:relative;">
      <svg width="100%" height="100%" style="overflow: hidden;">
          <g app-circle-x id="circleX"></g>
          <g app-circle-y id="circleY"></g>
      </svg>
  </div>
</div>
Setup child components:
- First, we need to add d3 reference.
- Then we need to mention the child selector referenced in app.component. html as shown:
circle-x.component.ts
import { Component, OnInit, ViewEncapsulation } from '@angular/core';
import * as d3 from 'd3';
@Component({
  selector: '[app-circle-x]',
  templateUrl: './circle.component.html',
  styleUrls: ['./circle.component.css'],
  encapsulation: ViewEncapsulation.None
})
export class CircleXComponent implements OnInit {
  private chartX: any;
  constructor() { }

  ngOnInit() {
}
}- Same thing should be done in circle-y.component.html
Creating graph with gradient circles in child components:
- Inside ngOnInit() we need to write our code for generating the D3 graph
- First, we create some dummy arrays for dummy data. This data can be dynamic based on your requirements.
circle-x.component.ts
let dumArray = [{ x: 100, y: 100 }, { x: 200, y: 100 }, { x: 300, y: 100 }, { x: 400, y: 100 }, { x: 400, y: 100 }, { x: 500, y: 100 }, { x: 600, y: 100 }, { x: 700, y: 100 }];
let gradData = [{ x: 100, grad: 0 }, { x: 200, grad: 25 }, { x: 300, grad: 33 }, { x: 400, grad: 50 }, { x: 500, grad: 75 }, { x: 600, grad: 88 }, { x: 700, grad: 100 }];
circle-y.component.ts
let dumArray = [{ x: 100, y: 200 }, { x: 200, y: 200 }, { x: 300, y: 200 }, { x: 400, y: 200 }, { x: 400, y: 200 }, { x: 500, y: 200 }, { x: 600, y: 200 }, { x: 700, y: 200 }];
let gradData = [{ x: 100, grad: 100 }, { x: 200, grad: 88 }, { x: 300, grad: 75}, { x: 400, grad: 50 }, { x: 500, grad: 33 }, { x: 600, grad: 25 }, { x: 700, grad: 0 }];- The first array depicts the x-y co-ordinates for the circles in the graph.
- The second array depicts the x co-ordinate position of the circles and the gradient values for each circle.
- Next, we need to define the scale so the we can position multiple graphs inside the parent svg as shown:
circle-x.component.ts
let maxValue = Math.max.apply(Math, dumArray.map(function (item) { return item.y; }));
let minValue = Math.min.apply(Math, dumArray.map(function (item) { return item.y; }))
let scale = d3.scaleLinear()
      .domain([minValue, maxValue])
      .range([35, 25]);
circle-y.component.ts
let maxValue = Math.max.apply(Math, dumArray.map(function (item) { return item.y; }));
let minValue = Math.min.apply(Math, dumArray.map(function (item) { return item.y; }))
let scale = d3.scaleLinear()
      .domain([minValue, maxValue])
      .range([85, 75]);
- Next, we need to select the container for the graph
circle-x.component.ts
this.chartX= d3.select("#circleX")
circle-y.component.ts
this.chartY= d3.select("#circleY")
- Next, we need to create the linear gradients as shown below:
circle-x.component.ts
let gradX = this.chartX
      .append("defs").selectAll("linearGradient").data(gradData).enter()
      .append("linearGradient")
      .attr("id", function (d) { return "gradX" + d.x})
      .attr("x1", "0%")
      .attr("x2", "0%")
      .attr("y1", "100%")
      .attr("y2", "0%")
      gradX.append("stop")
      .attr("offset", function (d) { return d.grad + "%" })
      .attr("stop-color", function (d) { return "red"; })
      gradX.append("stop")
      .attr("offset", function (d) { return (d.grad) + "%" })
      .attr("stop-color", "white");
The highlighted lines indicate horizontal gradient.
circle-y.component.ts
let gradY = this.chartY
    .append("defs").selectAll("linearGradient").data(gradData).enter()
    .append("linearGradient")
    .attr("id", function (d) { return "gradY" + d.x})
    .attr("x1", "100%")
    .attr("x2", "0%")
    .attr("y1", "0%")
    .attr("y2", "0%")
    gradY.append("stop")
    .attr("offset", function (d) { return d.grad + "%" })
    .attr("stop-color", function (d) { return "blue"; })
    gradY.append("stop")
    .attr("offset", function (d) { return (d.grad) + "%" })
    .attr("stop-color", "white");
The highlighted lines indicate vertical gradient.
- Next, we need to draw the line and path on which the circles are placed. This step is optional. Based on your requirement you can choose to draw the line /not.
circle-x.component.ts
let line = d3.line()
      .x(function (d) { return d.x })
      .y(function (d) { return scale(d.y) })

    this.chartX.append('path')
      .datum(dumArray)
      .attr('class', 'line')
      .style('fill', 'none')
      .style('stroke', "red")
      .style('stroke-width', '0.5')
      .attr('d', line)
circle-y.component.ts
let line = d3.line<any>()
      .x(function (d) { return d.x })
      .y(function (d) { return scale(d.y) })

    this.chartY.append('path')
      .datum(dumArray)
      .attr('class', 'line')
      .style('fill', 'none')
      .style('stroke', "blue")
      .style('stroke-width', '0.5')
.attr('d', line)- Lastly, we plot the circles as per dummy data.
circle-x.component.ts
this.chartX.selectAll('.dotX')
      .data(dumArray)
      .enter()
      .append('circle')
      .attr('class', 'dotX')
      .attr('cx', d => d.x)
      .attr('cy', d => scale(d.y))
      .attr('r', 15)
      .style("stroke", "red")
      .style("fill", d => {
        let returnColor;
        returnColor = "url(#gradX" + d.x + ")"
        return returnColor;
circle-y.component.ts
this.chartY.selectAll('.dotY')
      .data(dumArray)
      .enter()
      .append('circle')
      .attr('class', 'dotY')
      .attr('cx', d => d.x)
      .attr('cy', d => scale(d.y))
      .attr('r', 15)
      .style("stroke", "blue")
      .style("fill", d => {
        let returnColor;
        returnColor = "url(#gradY" + d.x + ")"
        return returnColor;
      })
The highlighted lines depict reference to the gradients and fill the circles accordingly.
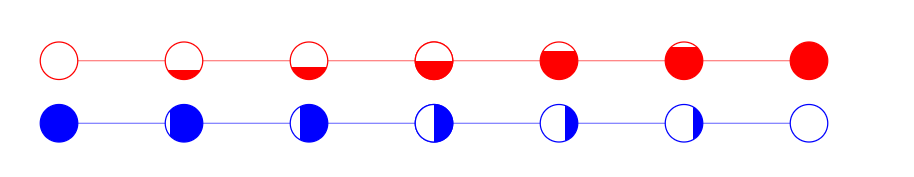
- The output of this code is displayed below (The application will run in your localhost at port 4200) : (http://localhost:4200/ )