When a SQL Query takes huge time to execute we start thinking for optimization. But before optimizing a query we need to know some basics facts/terms that you can consider as metrics for optimization. If we understand these basics properly then optimizing a query is really a piece of cake.
Logical and Physical operators:
Every SQL query comprises of logical operators which in turn convert into physical operators. So Logical operators are conceptual plan (User perspective) and Physical operators are actual logic/plan for that Logical operator to be executed by SQL Engine.
One logical operator can point towards multiple physical operators. When SQL Engine parse the query and found a logical operator, to complete that logical operation it could break it into multiple physical operators.
E.g. INNER JOIN is a logical operator that could be completed using physical operators like MERGE JOINS or NESTED LOOPS.
For more information you can visit http://msdn.microsoft.com/en-us/library/ms191158.aspx
How can we view these logical and physical operators for a query plan?
Now if we are able to find out what are the logical and physical operators comprises a query plan then improving a query performance is just like a piece of cake.
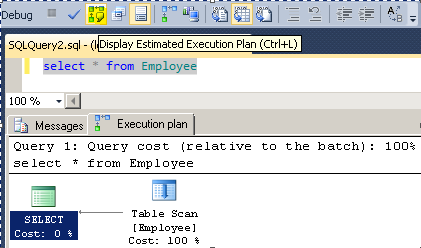
To view what are the logical and physical operators involved in a SQL plan you need to write the query on analyzer and selecting that one you need to hit the button ‘Display Estimated Execution Plan’ (Highlighted with yellow marker) as follows:

Here we find the above query is using ‘Table Scan’ Physical operator for execution.
Logical and Physical read:
There are two important concepts we need to understand while we do SQL Performance tuning. Those are Logical reads and Physical reads in which Logical reads are very important metrics to measure SQL performance.
Much we decrease the logical read I/O count we are improving the query performance.
When we execute a query for first time the result is read from actual physical file or actual I/O devices (hard disc) and stored into SQL Cache for future reference if any time required. Now if the same query is executed again the result is displayed from reading that from cache. So when data is read from actual file or actual physical I/O it is termed as Physical read and when data is read from cache it is termed as Logical read.
How can we display Physical read count and Logical read count for a query?
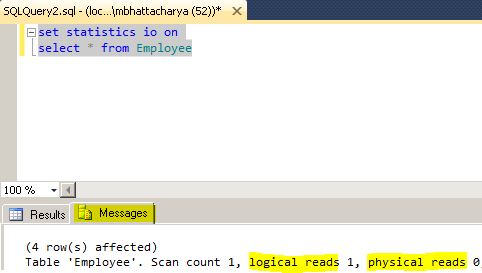
If we execute the above query in the following way we are able to find the Physical and Logical read counts as follows:

Here we find that Physical count is 0 since data has been already read out from physical devices and is put into cache and hence the logical read count gives value 1 since it’s read out from that cache.
Much we decrease the logical read I/O count we are improving the query performance.
Conclusion:
This is basically a stepping stone to query optimization. So before going further please try to understand the concepts and in coming days I will discuss on which situation we will use which operators like table scan, index scan, seek scan etc. and the best practices of using the same.


Good Post.