As business today is increasingly advancing its online presence, the associated threats for security breaches is also looming larger and organizations are constantly looking to safeguard their presence. Along with others, the threat to database has always been a key focus for ensuring the integrity of the data and in today’s world the target could very well be Azure SQL DB. Fortunately, Azure SQL Server offers a built-in solution named Vulnerability Assessment tool. Here is a link to Microsoft’s official page showcasing how it can be done using SSMS. You can also go to the Azure SQL Server blade in Azure portal and go to Advanced Data Security to enable and schedule the Vulnerability Scans and send an email to business users.
Now, to look at it, the scan reports are generated per database basis and stored in a blob storage. For an organization, data may lie across multiple databases and one needs to have a holistic view of the vulnerability across different Databases.
This is the premises of my discourse here and I will demonstrate a quick way to consolidate multiple such scan reports to create a useful Power BI dashboard.
So here we are into business and next we need to understand the scheme that we will be using to get this dashboard in place.
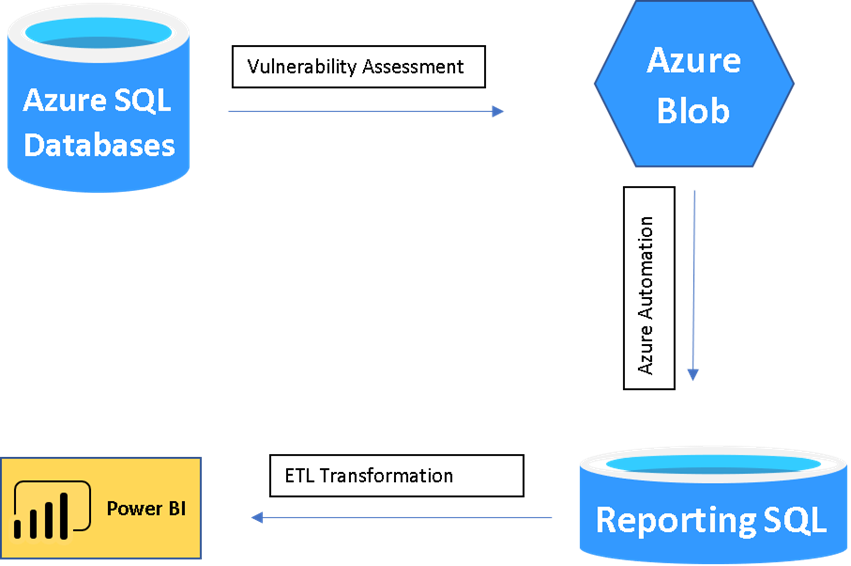
As you can see there are 4 parts to the overall task.
- Create the Vulnerability Assessment scans
- Extract the results of these scans
- Put the extracted results of the scans in a reporting database
- Create the reports in Power BI
Create the Vulnerability Assessment scans
As mentioned, we can create the scheduled scans either from the SQL Server Blade or we can go to the database blade. As for example, you can go to Advanced Data Security tab and go to Vulnerability Assessment page.
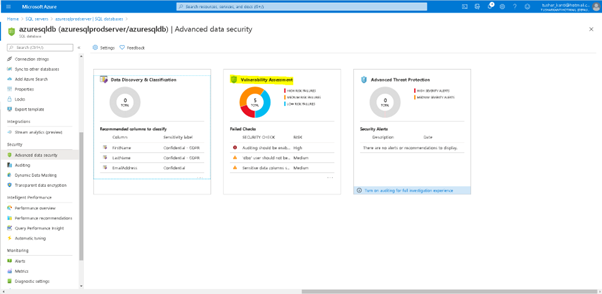
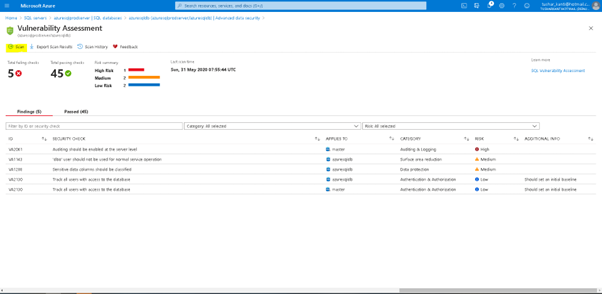
Here you can see the earlier Vulnerability Assessment, or you can click on scan to generate a fresh scan report.
Extract the results of these scans
Okay, so far, we got the scan report alright. To merge such scan results obtained from different DBs we need to pull in information from the Blob Storage. This activity can be divided into 3 sections
- Get the connection
- Get the Location of the latest vulnerability scan of the database
- Get the results of the scan of the database
Get the connection
The scan results are stored in the storage account that is associated with the advanced data security in the Azure Database Server. Let us explore the storage account to get the information of our scan records.
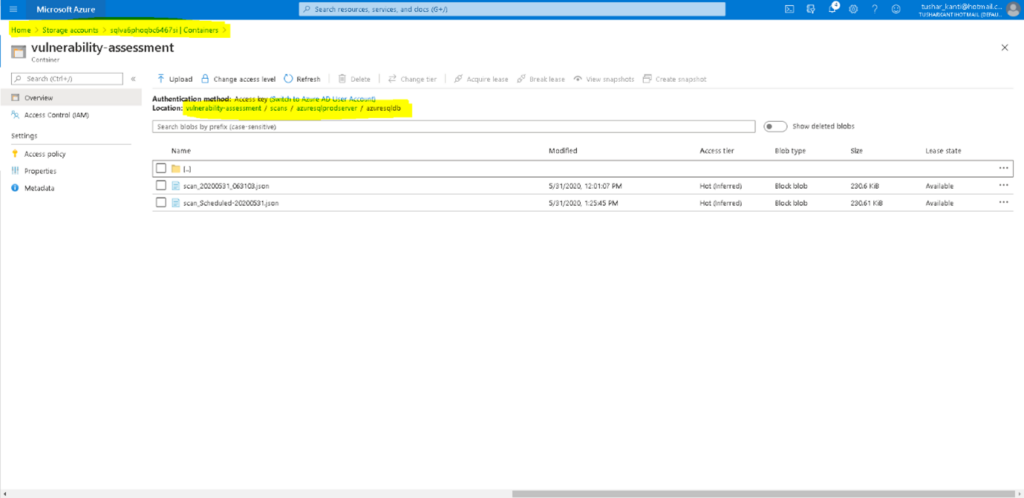
We understand that the data is stored inside a container in Blob Storage. We will need to find the latest one and then extract the results from the json document. We will be doing this using Azure Runbook in Azure Automation Account. So let’s create an automation account if it is not already there and import two modules Az.Accounts, Az.sql, Az.Storage and any dependent modules that we will need in our Azure Powershell Runbook. We will need the Az.storage module to interact with the blob storage in Azure.
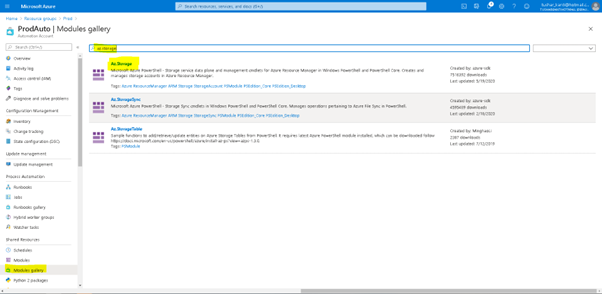
As shown in Figure above import the module from Module gallery in Azure Automation Account. It is to be noted all Azure Automation Accounts are mutually exclusive and importing a module in one does not mean it is imported in others. The modules take some time to reflect after they have been imported.
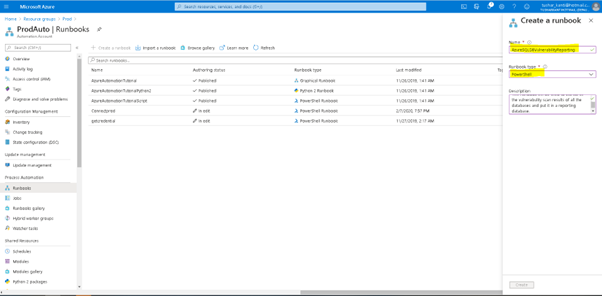
Let us create our runbook AzureSQLDBVulnerabilityReporting as a powershell runbook as is shown in the Figure below.
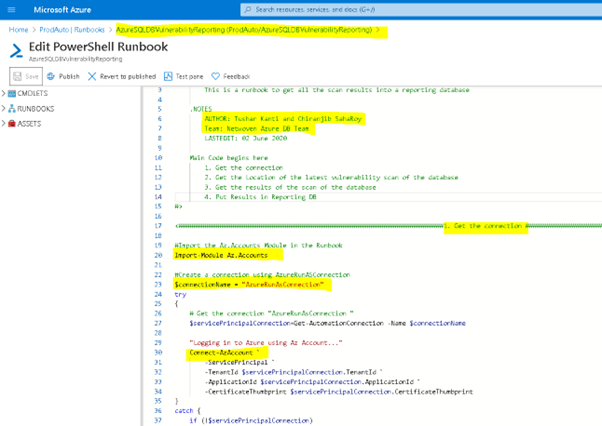
Now let us first create the connection in the Azure Runbook as shown below.
Get the Location of the latest vulnerability scan of the database
The cmdlet Get-AzSqlDatabaseVulnerabilityAssessmentScanRecord helps us to get all the scan Id’s of the database.
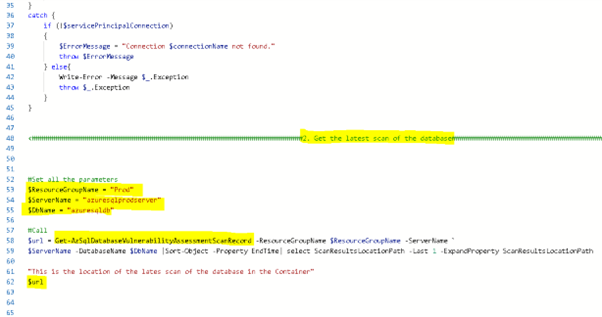
We then sort the results by Scan EndTime property and choose the last 1 to get the latest scan as is shown in the Figure above. It was really some effort to identify the properties of objects in Azure and now it should appear quite easy.
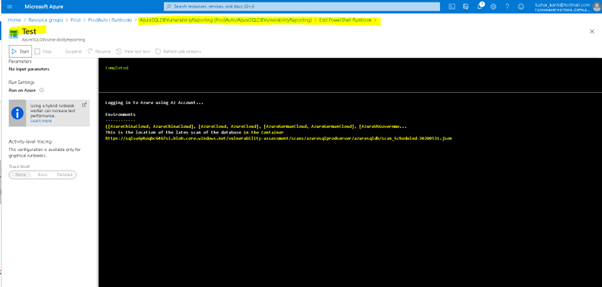
Now let us run the runbook and ensure we only get one row for the database scan. We get the expected results as is shown in the Figure above.
Get the results of the scan of the database
The Get-AzStorageBlobContent will get the content of the file stored in Azure Blob. We will need to pass the parameters required which includes the container(the main storage container) , the blob (which is the path of the blob inside the container) and context which is the context related to storage account name and storage account key as is shown in the figure.
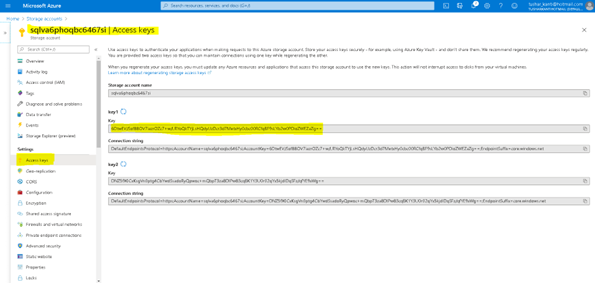
Now it is not a good idea to share the key of the Storage in plain text inside a code. So we will use the Get-AzStorageAccountKey cmdlet to get the key of the storage account.
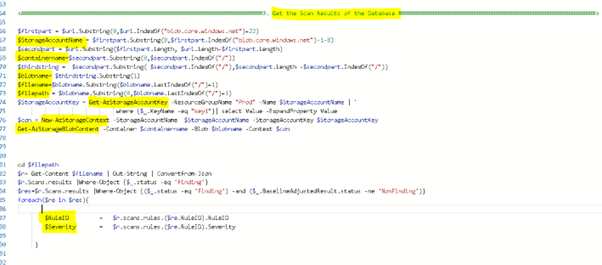
So we get all the parameters created for New-AzStorageContext and Get-AzStorageBlobContent. Once we get the data from the blob storage we identify the path in which it is downloaded and Get-Content of the file. The data is in Json format and hence we format it using convertfrom-json.
To extract the data from the Json, we consider two items, the status field and the severity of the rule. The Json has a lot of small documents and we need to browse the results document where the status field is ‘Finding’. Now to get the severity of the Rule we will join with Rule document and get the severity of the Rule. Once we have these two values we can either put them in a variable or store them in a table in the reporting SQL database.
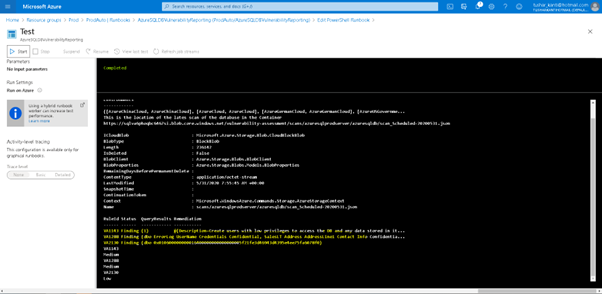
So as we see above in the figure that the data is consistent with our Scans Results obtained earlier.
Put the extracted results of the scans in a reporting database
Now we can store this result in a table db_vulner in a reporting database as is shown in the figure below.

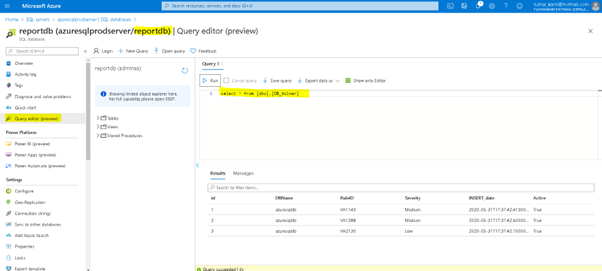
After executing the RunBook we can confirm the data in SQL Report Database as is shown in the figure below.
Create the reports in Power BI
Now we come to the final part of our activity where we show how to present the Vulnerability Scan Results that we have captured.
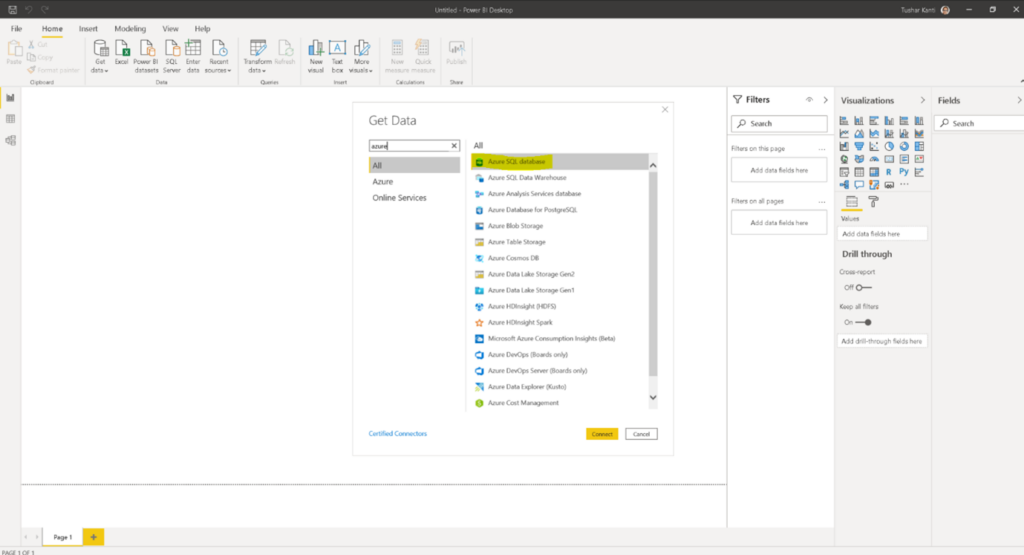
Open the Power BI desktop and click on connect search for Azure SQL Database and click on Connect as is shown in the figure below.
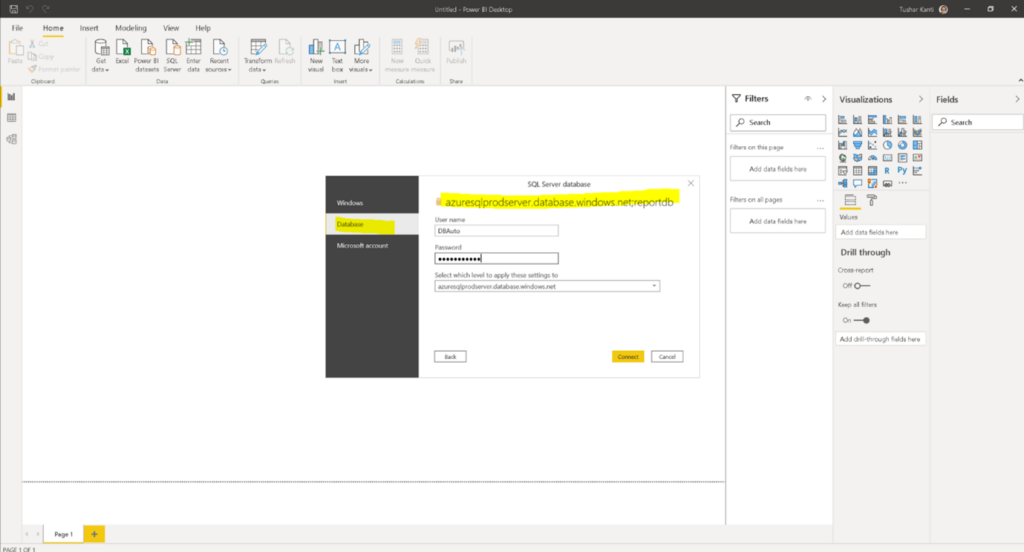
After giving the correct information for Server and Database choose the right authentication method and pass the credentials and click on connect as is shown in the figure below.
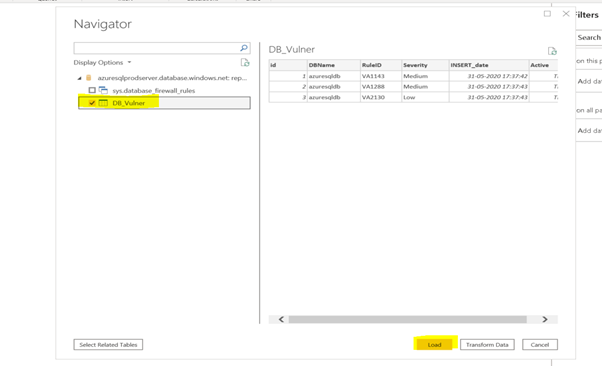
Choose the right tables and click on Load.
Once you are in the Page1 create a new Measure which will be number of vulnerabilities as is shown in the figure below.

Once you are done choose a donut or your favorite chart to show case the data as is shown in the final figure below.
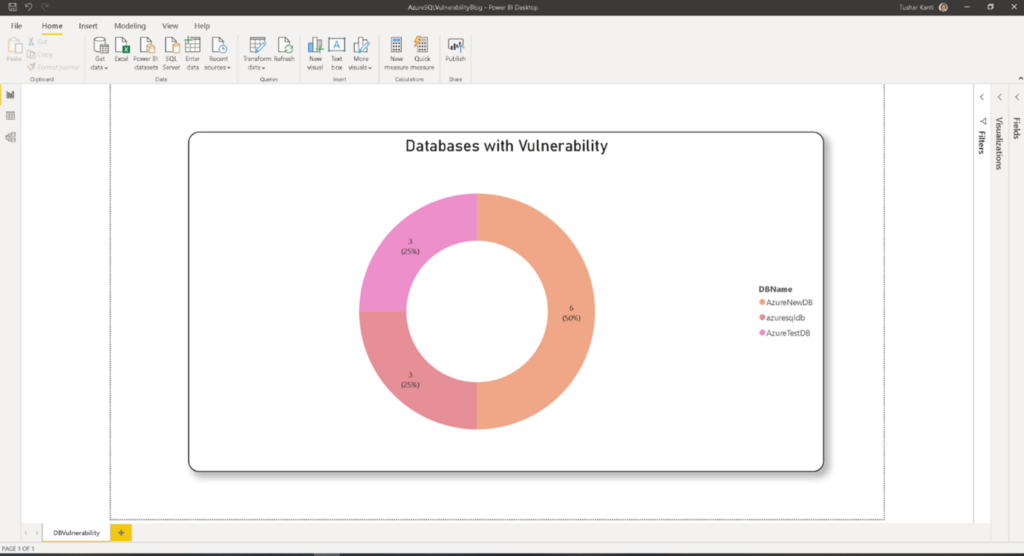
The final result is one comprehensive view for the vulnerability results for all the databases. Once, you are able to fetch the results from multiple databases, you are free to create your own report whatever way you need. The dashboard becomes your one stop monitoring point for all the scan results.
Cool, isn’t it ?
Please feel free to comment or write back, I will be happy to answer any questions you might have.

