
If you’ve been following my blogs, you’d be half expecting this ‘complexity’ that I mentioned in my last blog. However, for those you haven’t been following the series, you can still start afresh from this.
In this case study, I’ve a Customers table, named Table 1 with one column with unique values – say our primary key Customer ID, which forms a foreign key in Sales tables (three in this case – Table X, Table Y, Table Z). For a simple start, the latter 3 tables have another column ‘Sales’ on different dates for one or more Customer IDs.
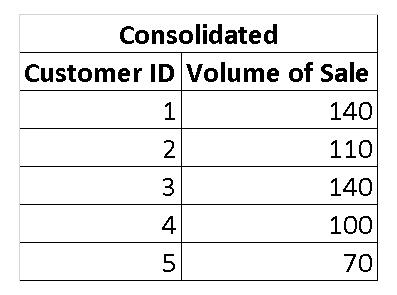
The intent is to consolidate all Sales tables to aggregate the sum of Volume of Sale for all Customer IDs across the tables, so that our summary data looks like one in the below table.
What is the complexity?
If it were a simple merging of data between tables, a simple VLOOKUP type excel function could help. However, this is data aggregation, along with the Customer ID being a foreign key in Sales tables posing a challenge because of 1 to Many relationship between Customers and Sales tables.
Another complexity is existence of multiple related tables, which means data from all Sales tables has to be aggregated.
How to approach the solution?
Power BI gives us a few options to get to our objective. We can approach the solution by the Query Editor or the DAX approach.
Let’s look at the Query Editor approach in this blog. On the Power BI desktop application, click Home > Edit Queries

- Append data from all Sales tables
In the Query Editor, click on Home > Append Queries > Append Queries as New

- Select the 3 Sales tables from Available Table(s) and Add to Tables to append

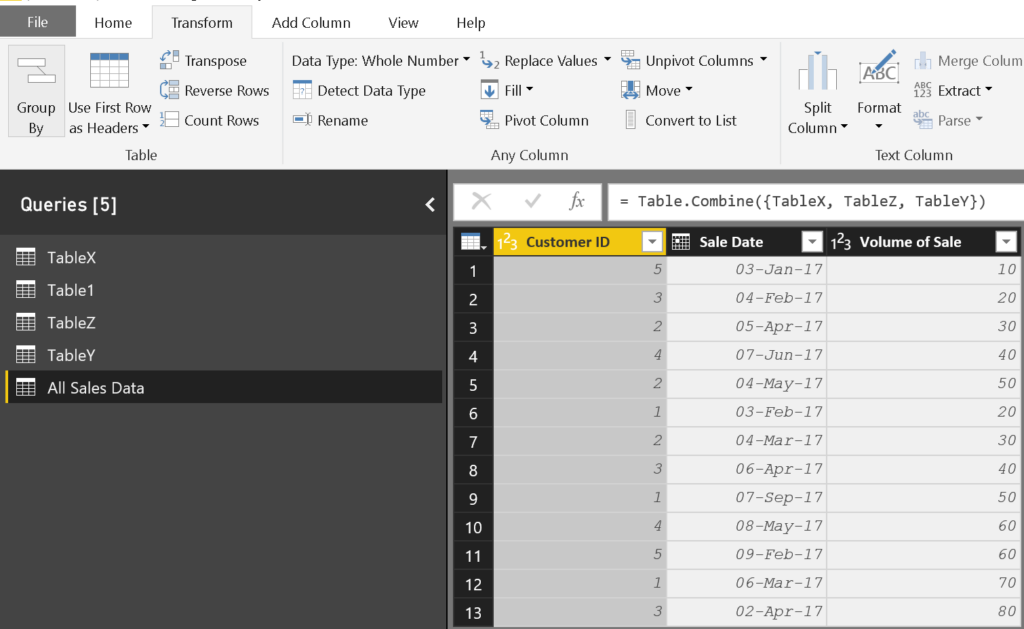
- A new table Append is created in the Query Right click and rename it appropriately, as I’ve in this case All Sales Data

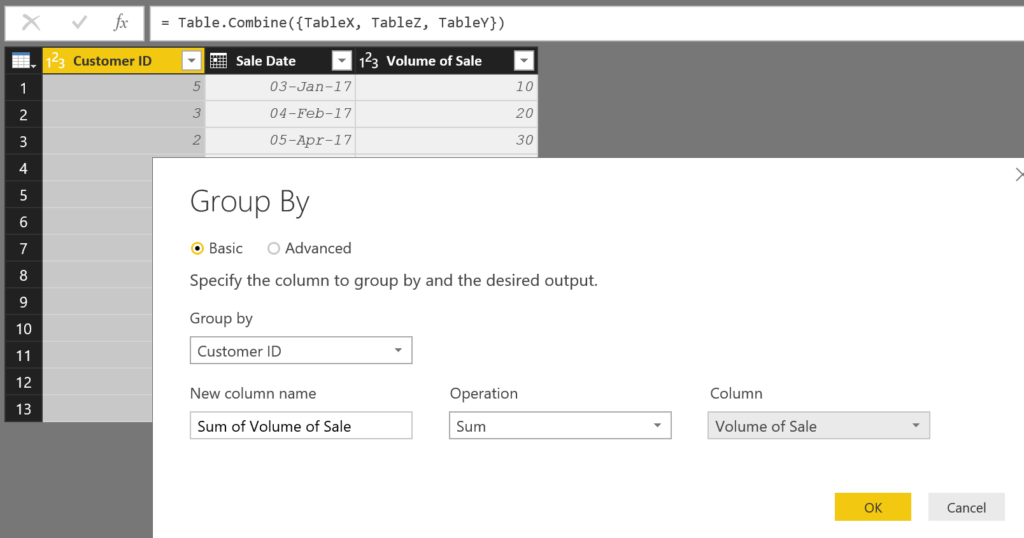
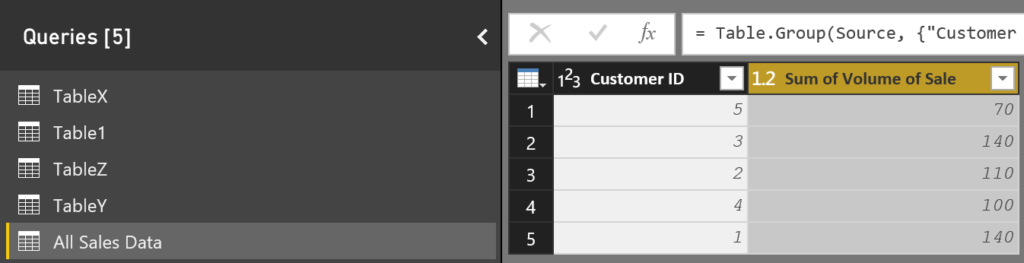
- Select the All Sales Data table and click on Transform > Group By
- Group by Customer ID to sum Volume of Sale
The All Sales Data table now condenses as the one in the following figure.
How does Power BI score here?
If you still couldn’t estimate the potential of Power BI, think of a scenario where number of Customer IDs were more than a countable few. It would have been practically impossible to filter on each Customer ID and sum the Volume of Sale. Another reason, even if you had approached it in a conventional way using formulae, a large possibility that you’d have ended up creating data horizontally for each customer instead of vertically which would still put you in the same spot of condensing data.
Is there more that Power BI can offer?
If you thought this was a very dry and tasteless approach after speaking volumes about Power BI, wait for my next blog on the same case study for folks depending more on visuals than tabular data.