Introduction
We’re constantly in a race against time, 100 mph. What are we trying to prove?
Ever wondered how much our heart is susceptible to daily work-related stress and in turn cardiovascular diseases?
Here is the irony. It is a fatal heath risk globally, but we rarely pause to give it some serious consideration. Approximately 80% of cardiovascular disease (CVD) deaths result from strokes and heart attacks, and about 33% of these fatalities occur prematurely in individuals under the age of 70.
In this blog, we highlight how to develop a Machine Learning (ML) model that can predict heart attack risk among existing patients using Microsoft Fabric .
How to develop a Machine Learning Model that predicts the risk of heart attack
A healthcare provider used a database of historical patient details and created a dataset taking one or two factors like diabetes, hyperlipidemia, hypertension or already established disease. It includes 11 features that can be utilized to predict the likelihood of heart disease.
We will show you a step-by-step approach to develop a Machine Learning model that can be used to predict high-risk heart attacks among their existing patients so that effective preventive treatment can be initiated.
Ebook: Machine Learning with Microsoft Fabric
Netwoven, a leading Microsoft consulting firm, brings you this comprehensive guide to unlocking the transformative potential of Artificial Intelligence (AI) within your familiar Microsoft 365 environment.
Get the eBookFrom Data to Decisions in Microsoft Fabric – A step-by-step Machine Learning Model
Buckle up for a step-by-step journey through a straightforward data science project.
Together, we’ll start by procuring data, then create ML models, and finally use these models to make inferences within Microsoft Fabric.
Here we go!
1. Select a Workspace
First things first. We start by creating a Microsoft Fabric workspace. This will serve as a location to store data and code while working on the prediction model.
Microsoft Fabric Workspace is the ideal choice here because it provides highly scalable compute, enterprise-scale data storage and distribution capabilities.
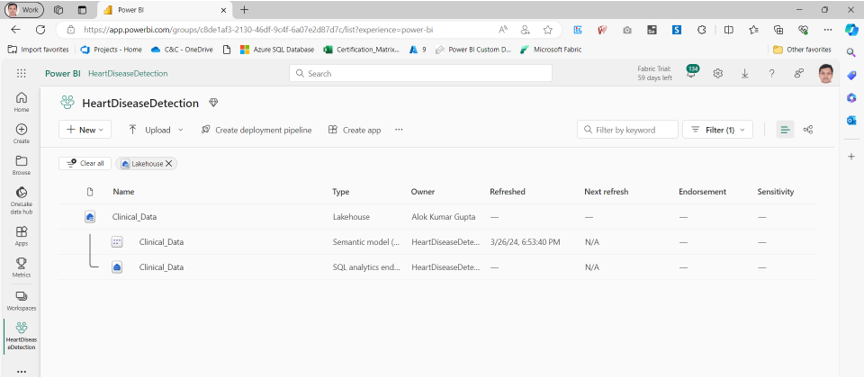
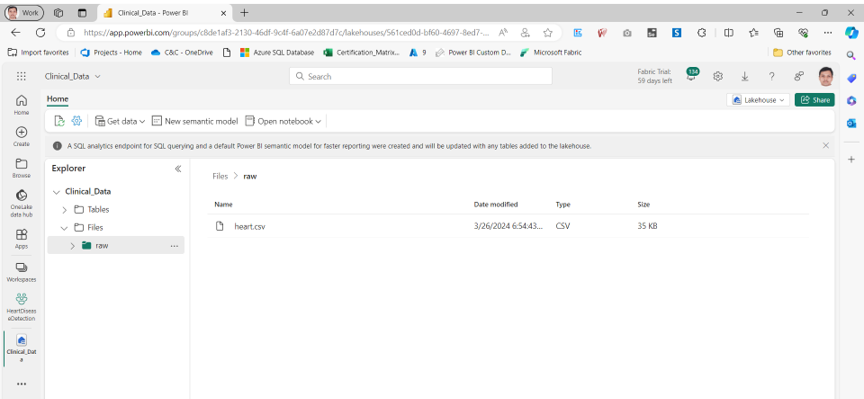
To store our data, we’ve established a Lakehouse. A Lakehouse is a modern data architecture that combines the best features of data lakes and data warehouses, allowing for both unstructured and structured data storage and management. Since our data often comes in unstructured formats, such as CSV files, we upload these files to the Files section of the Lakehouse, which is specifically designed for unstructured data.
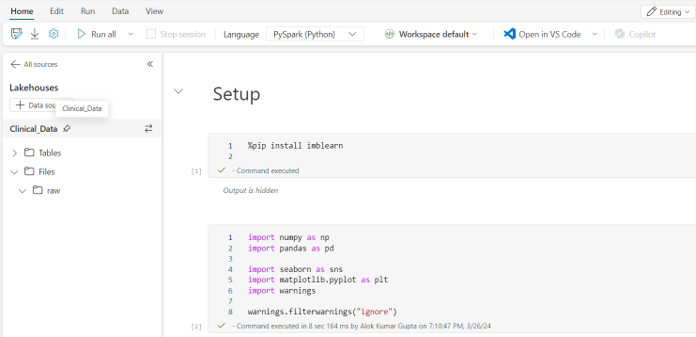
2. Code
To work with data, we’ve chosen Python because it offers a wide range of enterprise-grade data science libraries. We’ll write and execute our code using a Notebook stored within the same workspace, which will be connected to the Lakehouse.
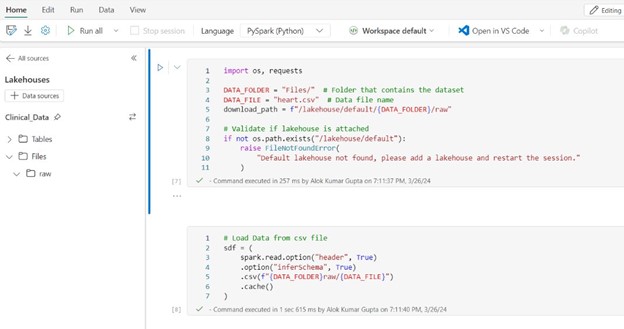
3. Loading Data for Processing
We begin our data work by loading the CSV file from the Lakehouse into memory as a DataFrame within the Notebook.
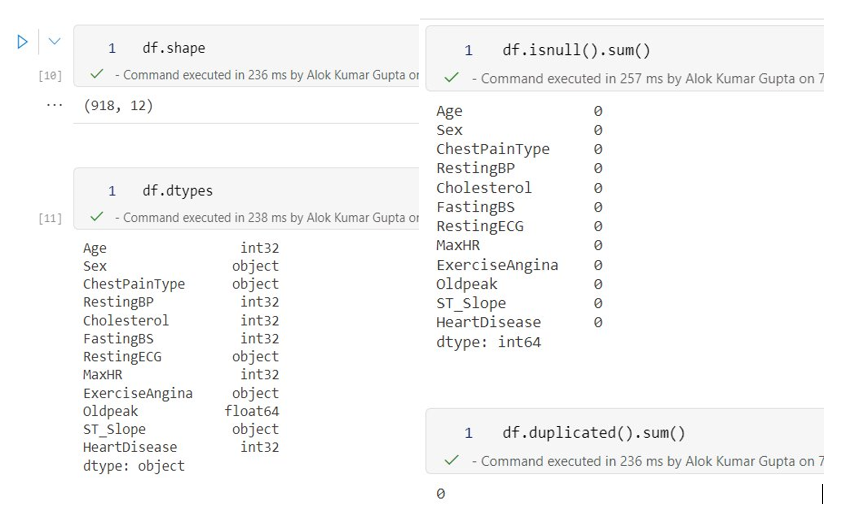
4. Data Exploration
The initial step in model construction involves understanding the data through exploration of the dataset’s stored values. Here, we commence by analyzing the data structure using DataFrame methods to identify column types, null values, duplicate records, and more.
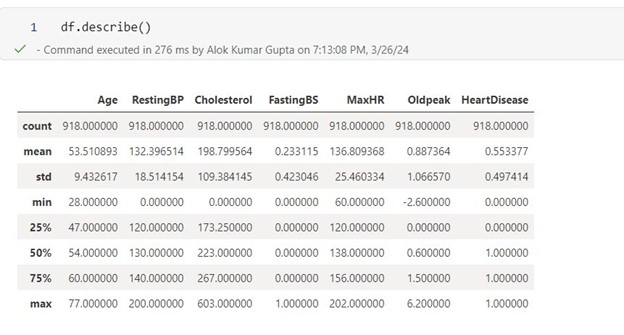
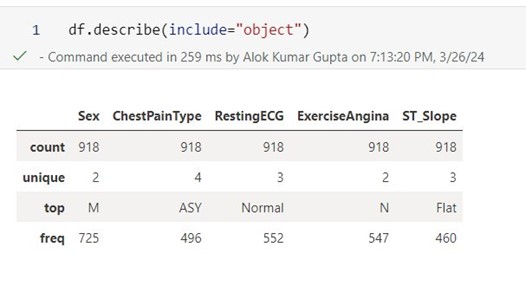
Furthermore, we employ statistical methods to analyze values across different columns or features, such as calculating means, counts, deviations, and the spread of values.
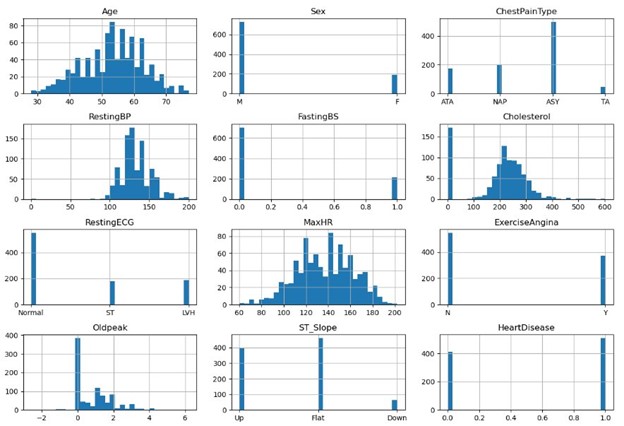
Next, we explore visually by employing various types of charts. Initially, we examine a combined histogram that encompasses all columns.
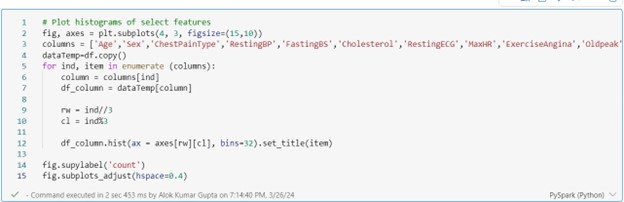
Some observations
- Age looks well-rounded.
- Most patients are male.
- Number of patients with 0 cholesterol seems to be an aberration
Plot value counts in different features/columns to understand the spread of data and aberrations
In the second chart presented here, the type of heart pain is plotted against patients diagnosed with heart disease.
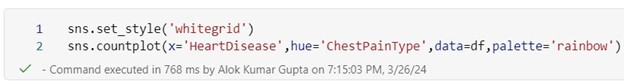
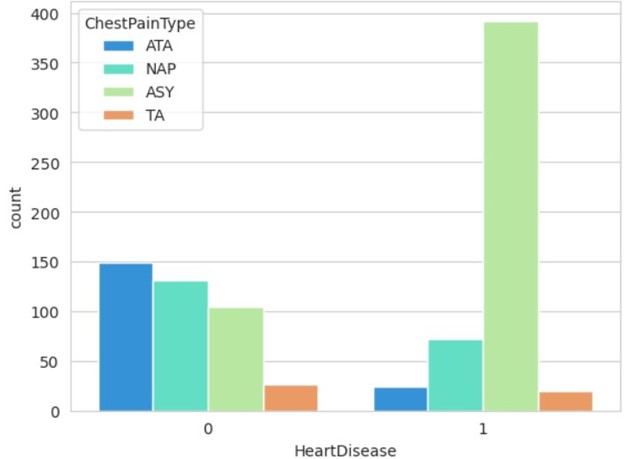
Observations
- As expected, most patients without heart diseases do not have TA heart pain.
- Unexpectedly, most patients with heart disease have asymptotic heart pain.
Although the male-to-female ratio in the sample leans towards males, the data for patients with heart disease is even more skewed, suggesting that male patients are more likely to have heart disease according to the data.
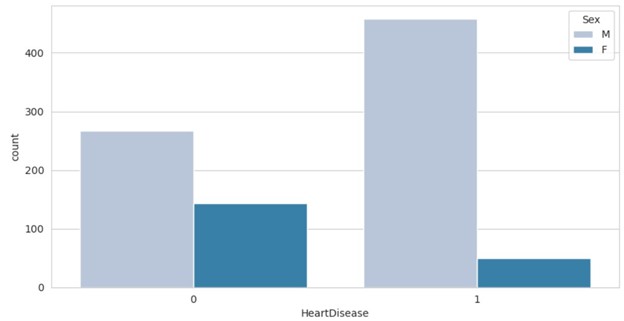
In this 3rd example, the sex of the patient is plotted against heart disease.
5. Select Features to be Used for Building the Model
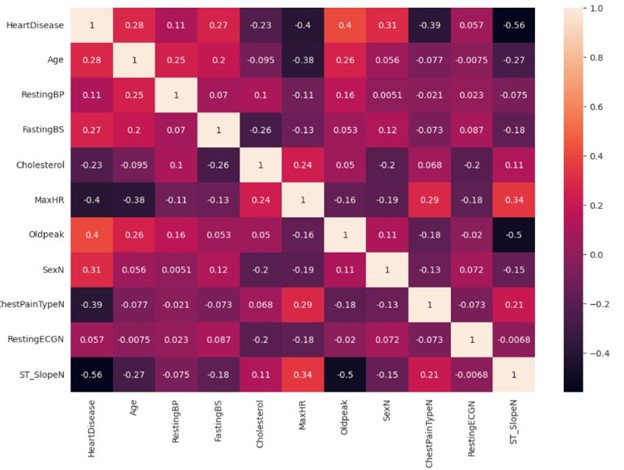
To make accurate predictions, it’s crucial to select the most relevant features for predicting the target variable. To prevent overfitting, we must exclude features with minimal dependency. To achieve this, we’ll employ a correlation matrix to assess the correlation between features and targets. Strong correlations are indicated by values close to 1 or -1.
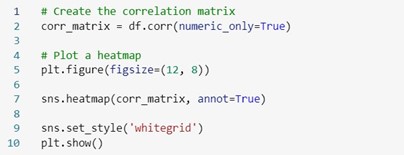
Observations
In this case, none of the features alone indicate the presence of heart disease. Hence, we need to use almost all except a few with very low correlation for prediction modelling.
6. Prepare Data for Modeling
Since we’ve identified the features, we want to utilize for modeling, we’ll proceed to transform the data to enhance our modeling and learning process. While the specific steps may differ for each dataset, the ones outlined here are essential.
- Separate target variable from features

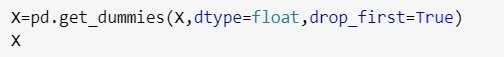
- Convert categorical fields to numeric fields

- Divide data into training & testing datasets
7. Normalize Training Dataset
To ensure unbiased learning, models require a comparable number of instances for all target values. Achieving this involves either generating additional sample data or removing similar data values. As a result of this step, you’ll observe that the number of records is now equal for both target values.


Ebook: Fabric Copilot Generative AI and ML
This eBook gives all the information about Fabric Copilot and how simple it is to enable Copilot which is another generative AI. IT brings about new ways to transform and analyze data, generate insights, and create visualizations and reports in Microsoft Fabric.
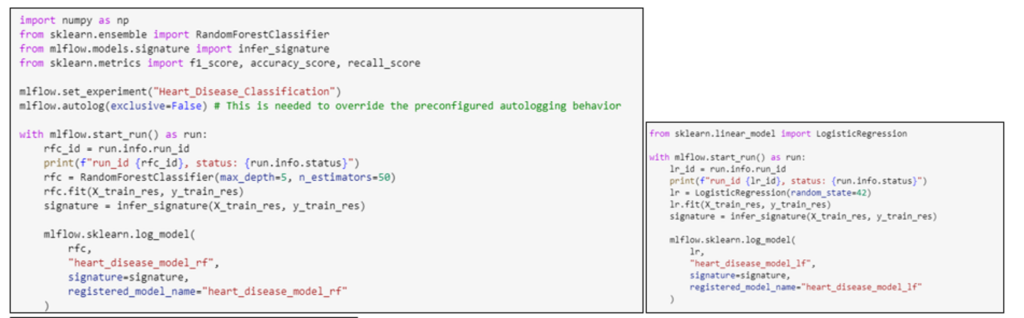
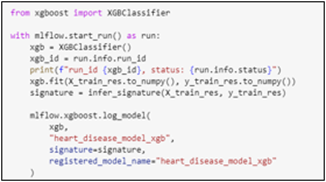
Get the eBook8. Create Data Science Experiment
Initially, we’re uncertain which algorithm will be most effective. Considering the prediction requirements, we opt for a classification model. From this domain, we select three models: RandomForestClassifier, LogisticRegression, and XGBClassifier. We then conduct an experiment, training these models with the data to compare their predictive performance.
9. Evaluate Model Performance
Following that, we proceed to evaluate the models. To do so, we navigate to the experiment created in the previous step and compare their performance using the “View run list” option.
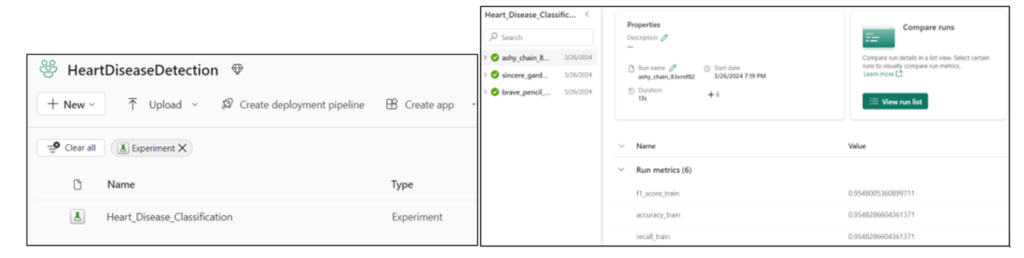
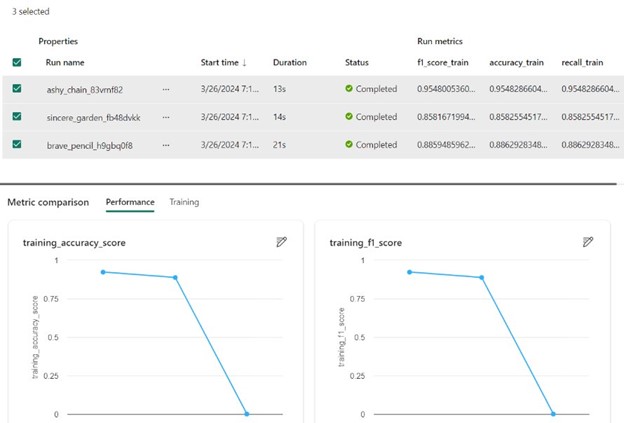
10. Select Best Model
Now, we’re able to compare the performance of models using various parameters such as accuracy, F1 score, and more. This enables us to make a well-informed decision regarding which model to utilize.
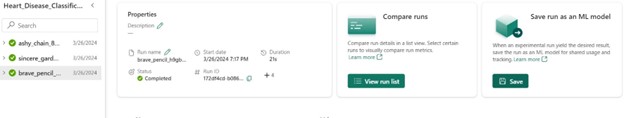
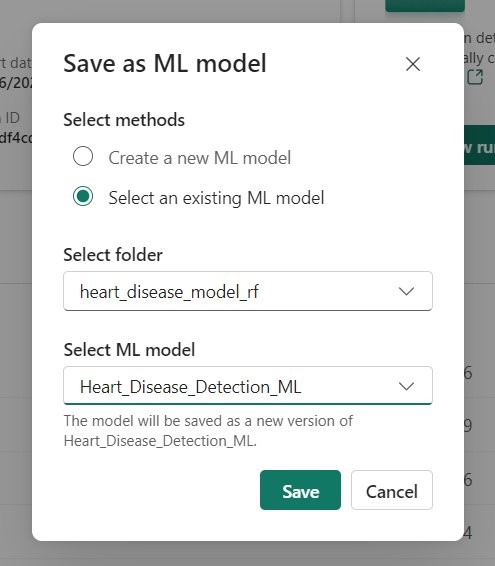
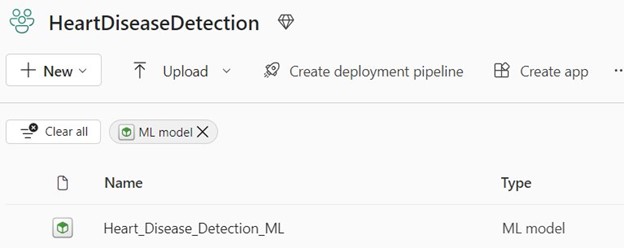
11. Make ML Model Available to the Organization
We’re now prepared to share our ML model with the rest of the organization. To do this, we select the model and utilize the “Save” button to store this model in a dedicated workspace, which is then shared across the organization. As this experiment is conducted repeatedly with new data, new versions of the model can be saved within the same workspace, enabling data scientists to select appropriate versions and compare them with older ones.
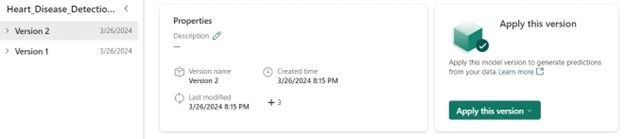
12. Inference
To perform inference, follow these steps in your workspace:
- Open the ML Model.
- Select the desired version.
- Click “Apply this version.”
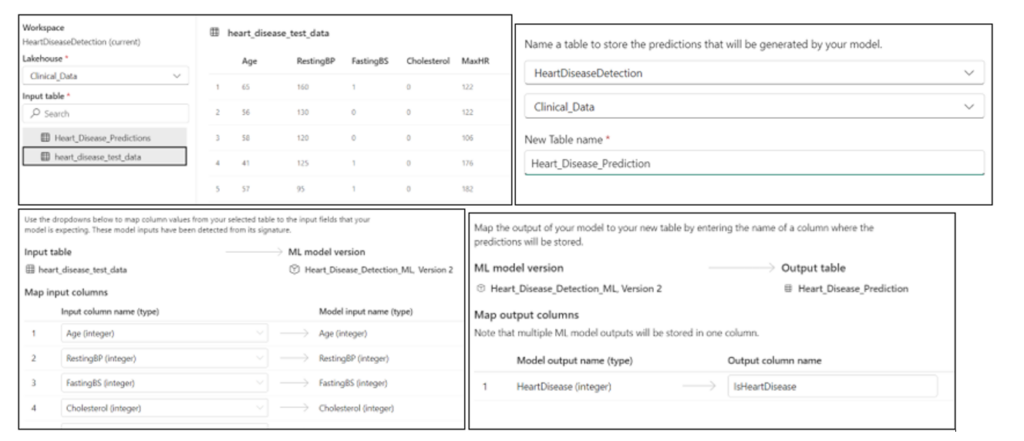
To proceed, follow these steps in the wizard
- Select the delta table containing the data.
- Map the columns appropriately.
- Enter a table name to store the results.
- Specify the column name for the target values.
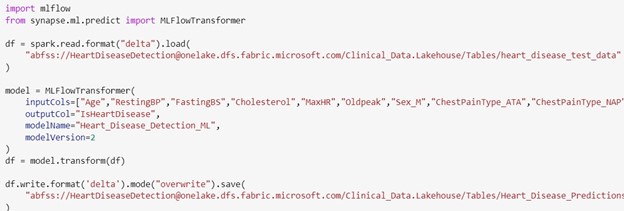
You can either create a new Notebook with the code or copy it into an existing Notebook to perform inference or predictions.
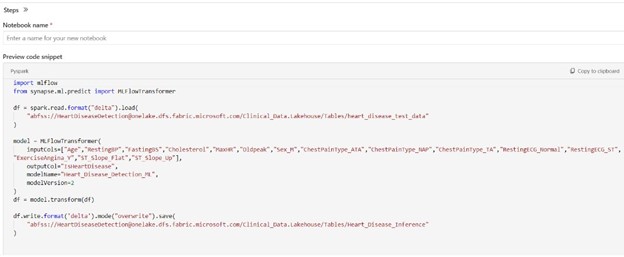
13. Execute Notebook for Inference
When executed, the code downloads the model, performs predictions using the provided data, and stores the results in a new delta table; it can be customized to work with different data sources or output formats.

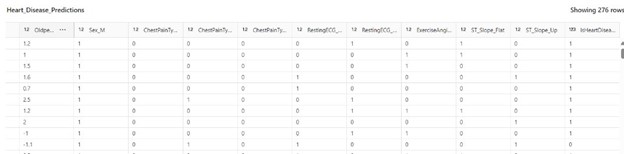
14. Predicted Data
The data now includes an additional “IsHeartDisease” column, which contains the intended predictions. These predictions can be used as the final data product for reporting or further processing.
Webinar: Advanced Deep Dive Demos with Microsoft Fabric. Watch Now.
Conclusion
In wrapping up, I hope this blog has shed some light on breaking down a Machine Learning model for predicting heart attack risks using Microsoft Fabric. The same approach can be applied to other types of predictive analysis. The key is to pick the right ML algorithm with the help of human experts, ask the right research questions, and track all relevant evaluation metrics. It’s also important to compare the model against conventional risk models. Once all these steps are taken care of, the ML model can be integrated with various healthcare devices to better monitor patient data and improve predictions. For more information, don’t hesitate to reach out. We’d love to hear your thoughts and explore new possibilities together in the realm of Machine Learning within Microsoft Fabric.